The supply chain six partners never had.
No platform existed — this was a 0→1 build from a blank slate. Six pharma partners running nine manufacturing sites on spreadsheets and phone calls — sharing nothing, seeing nothing, learning about exceptions at the delivery gate when the cost was already three to five times higher than catching them a week earlier. One platform ended that. All six companies adopted it. Zero to live in twelve months.
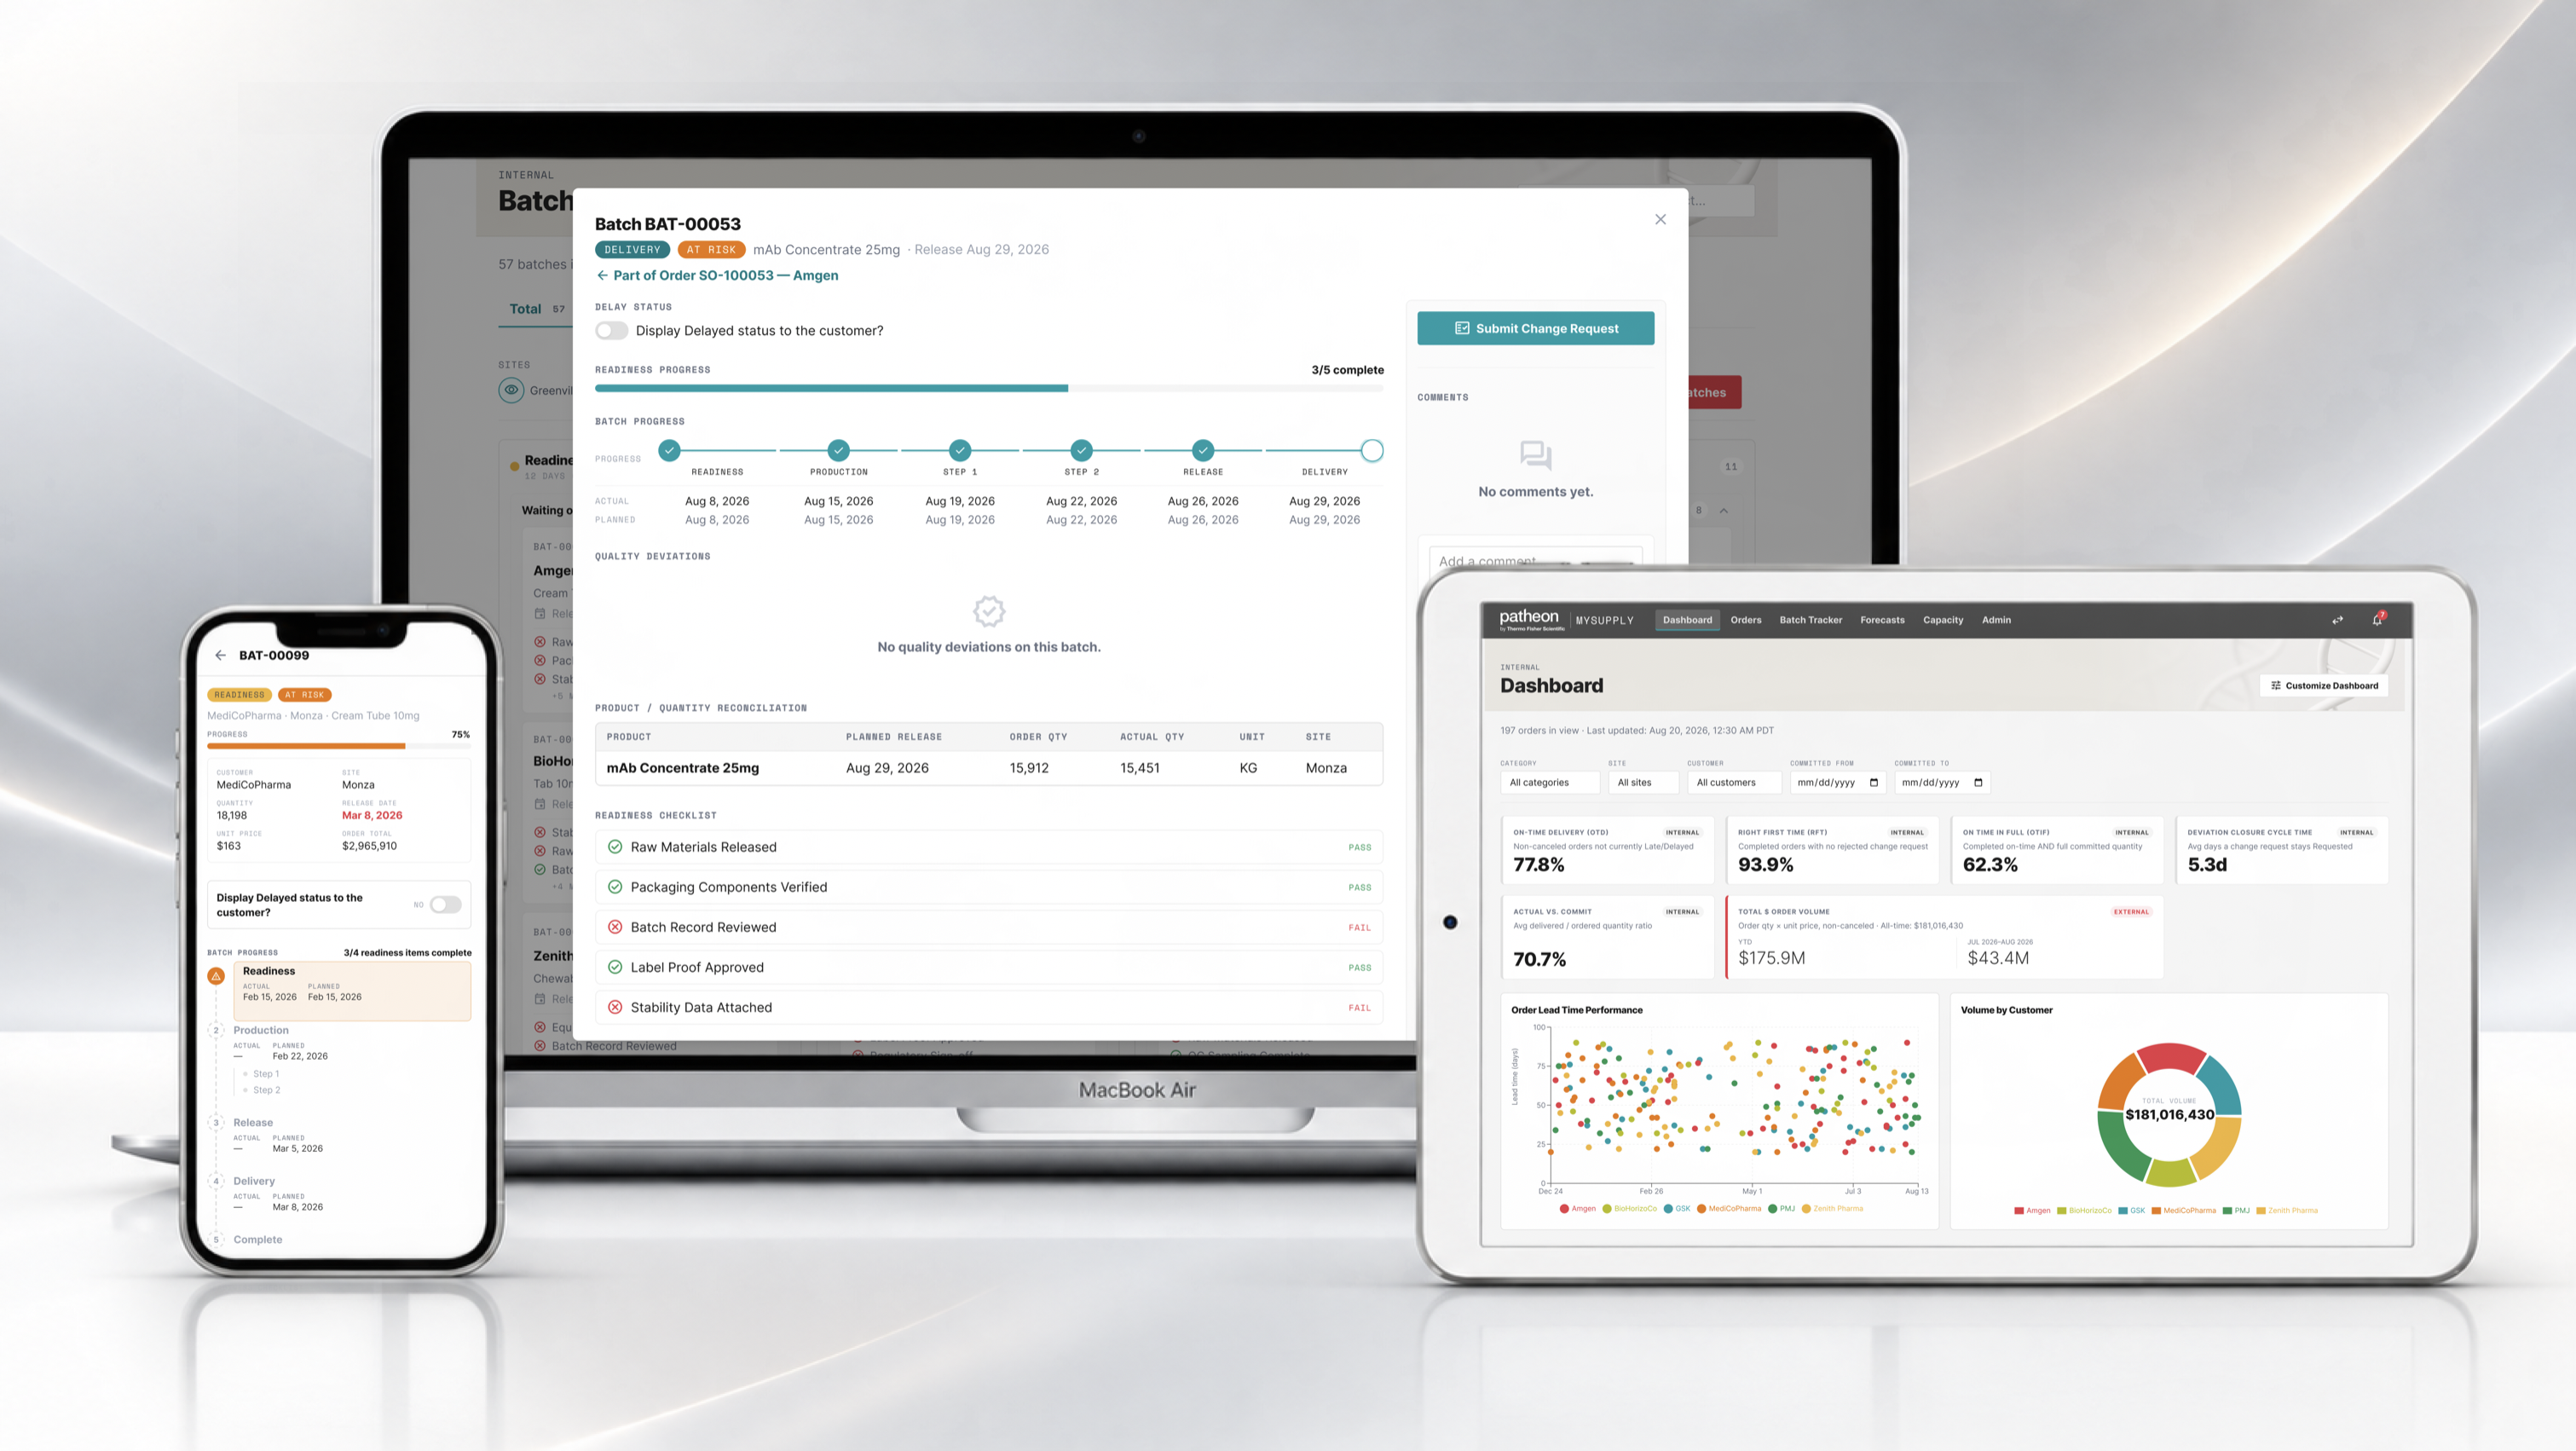
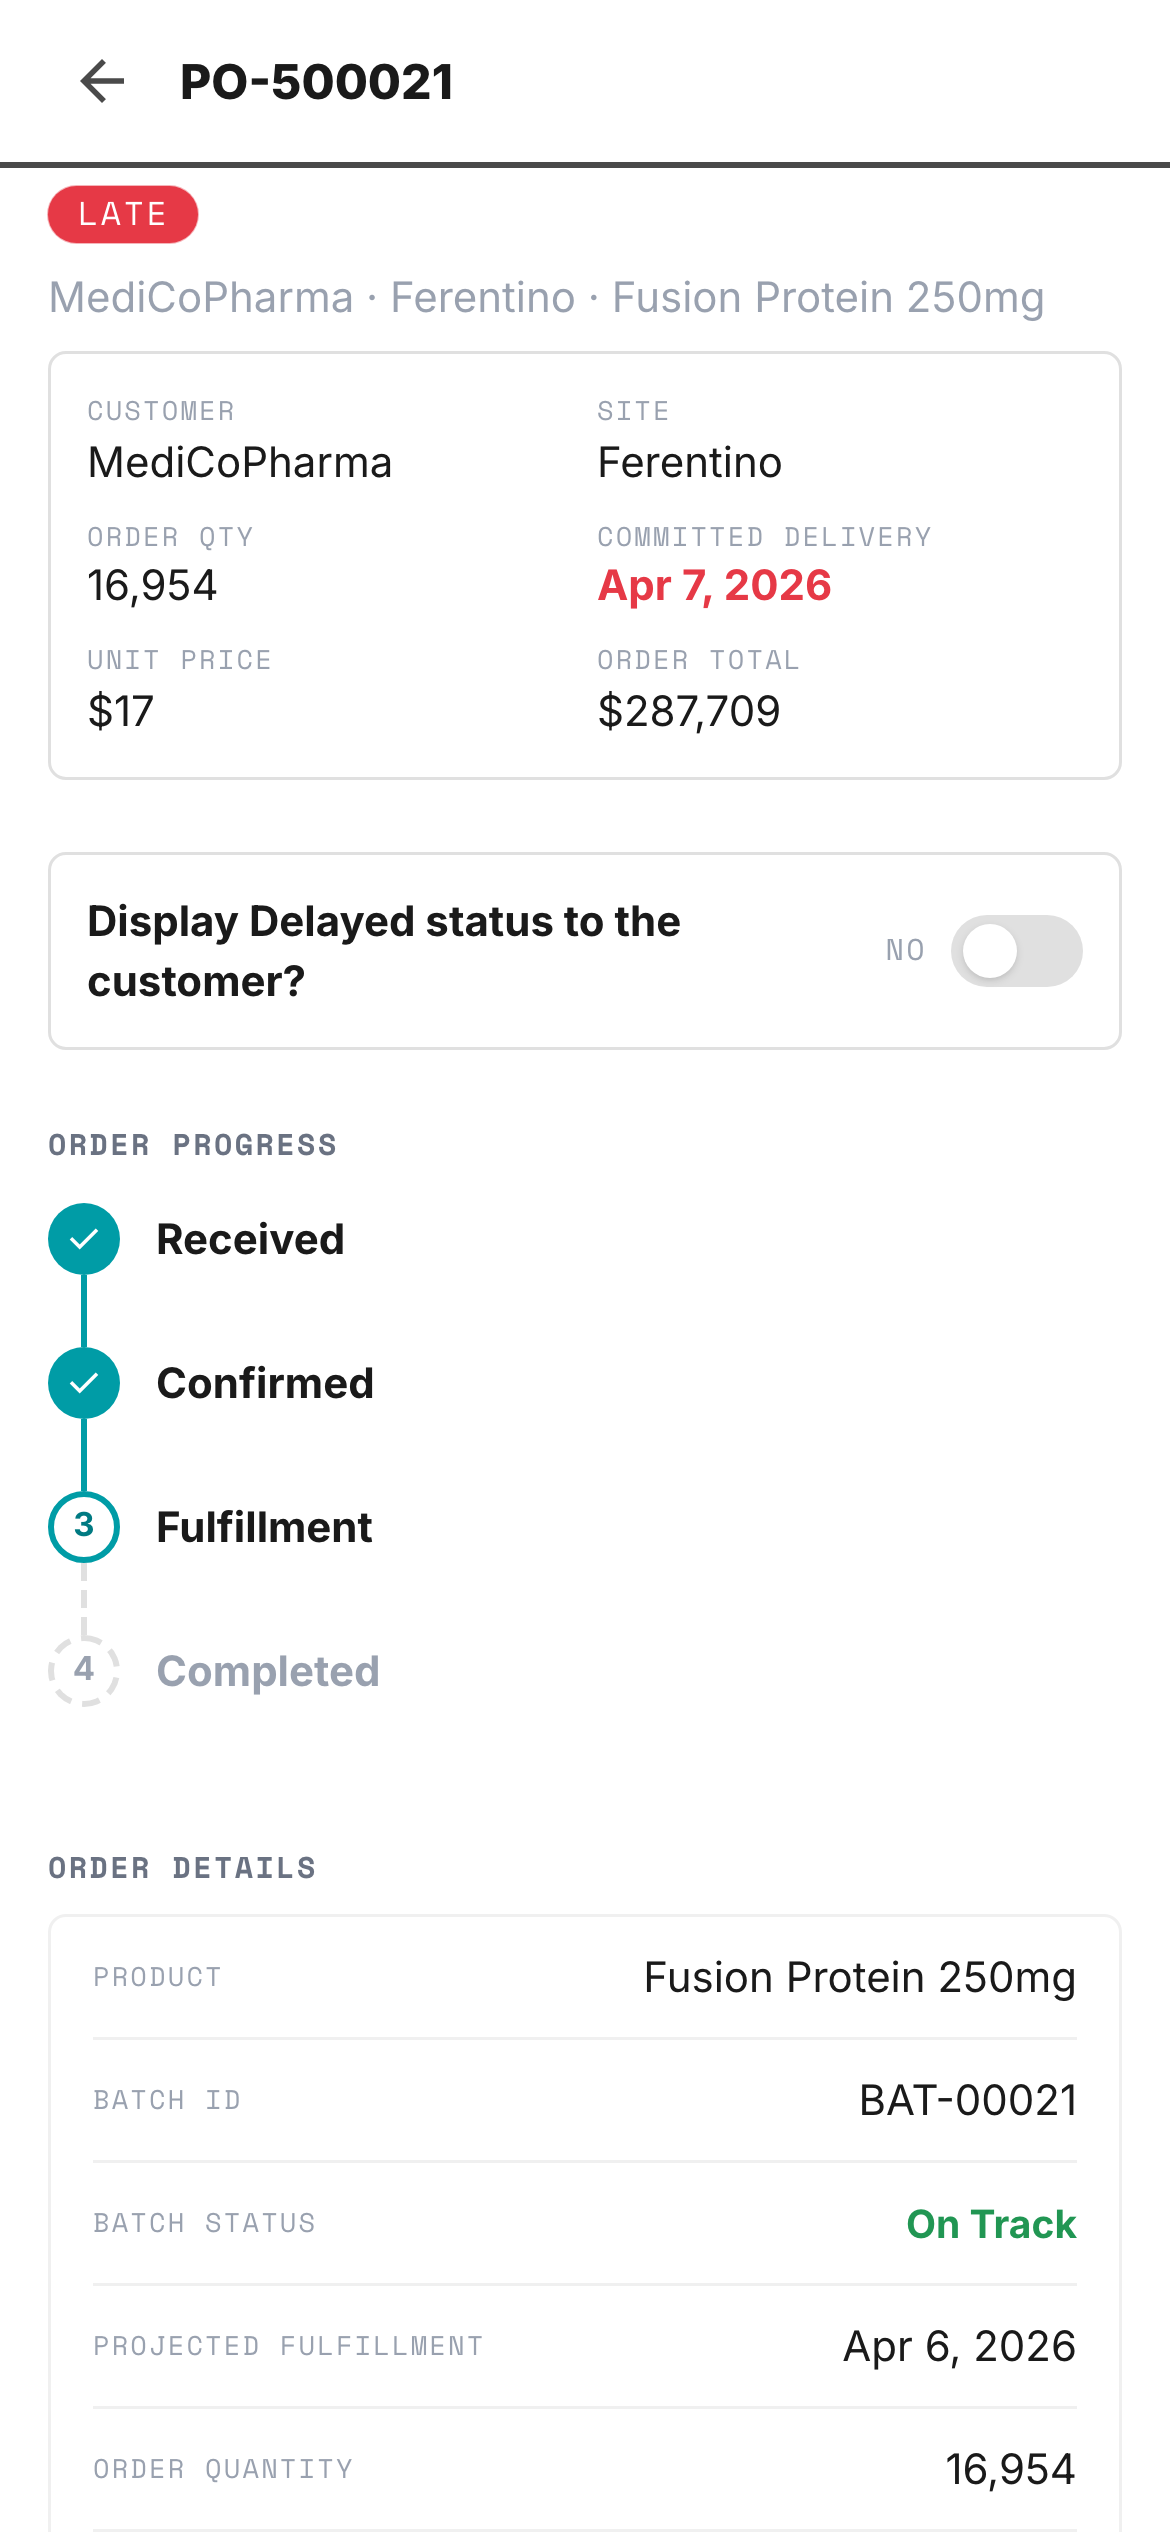
Exceptions surface. Nobody hunts.
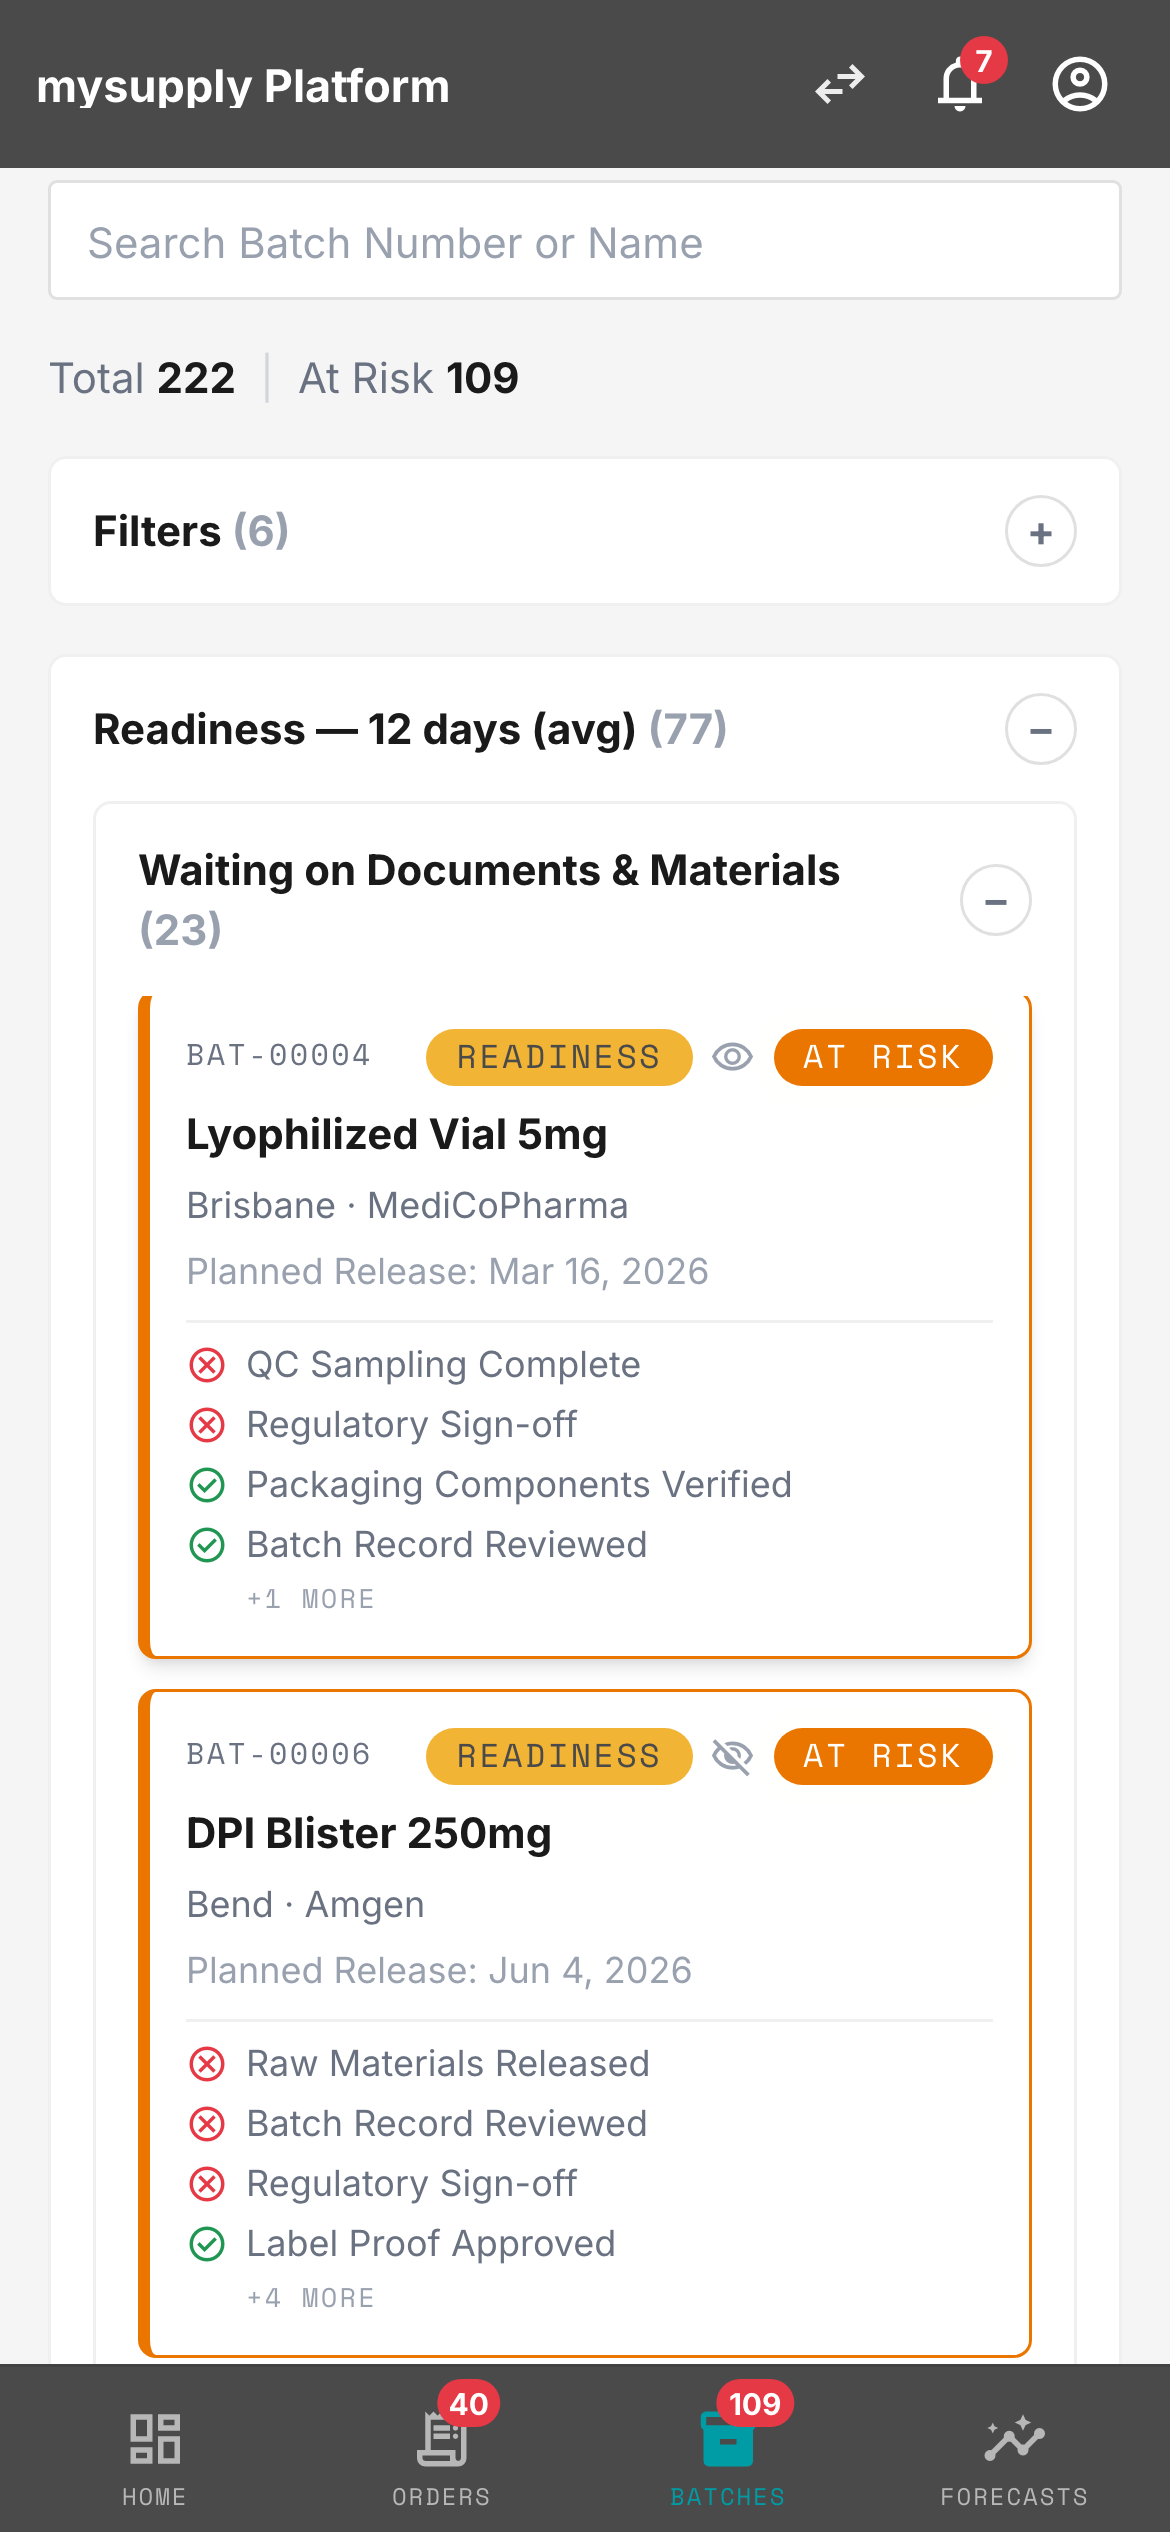
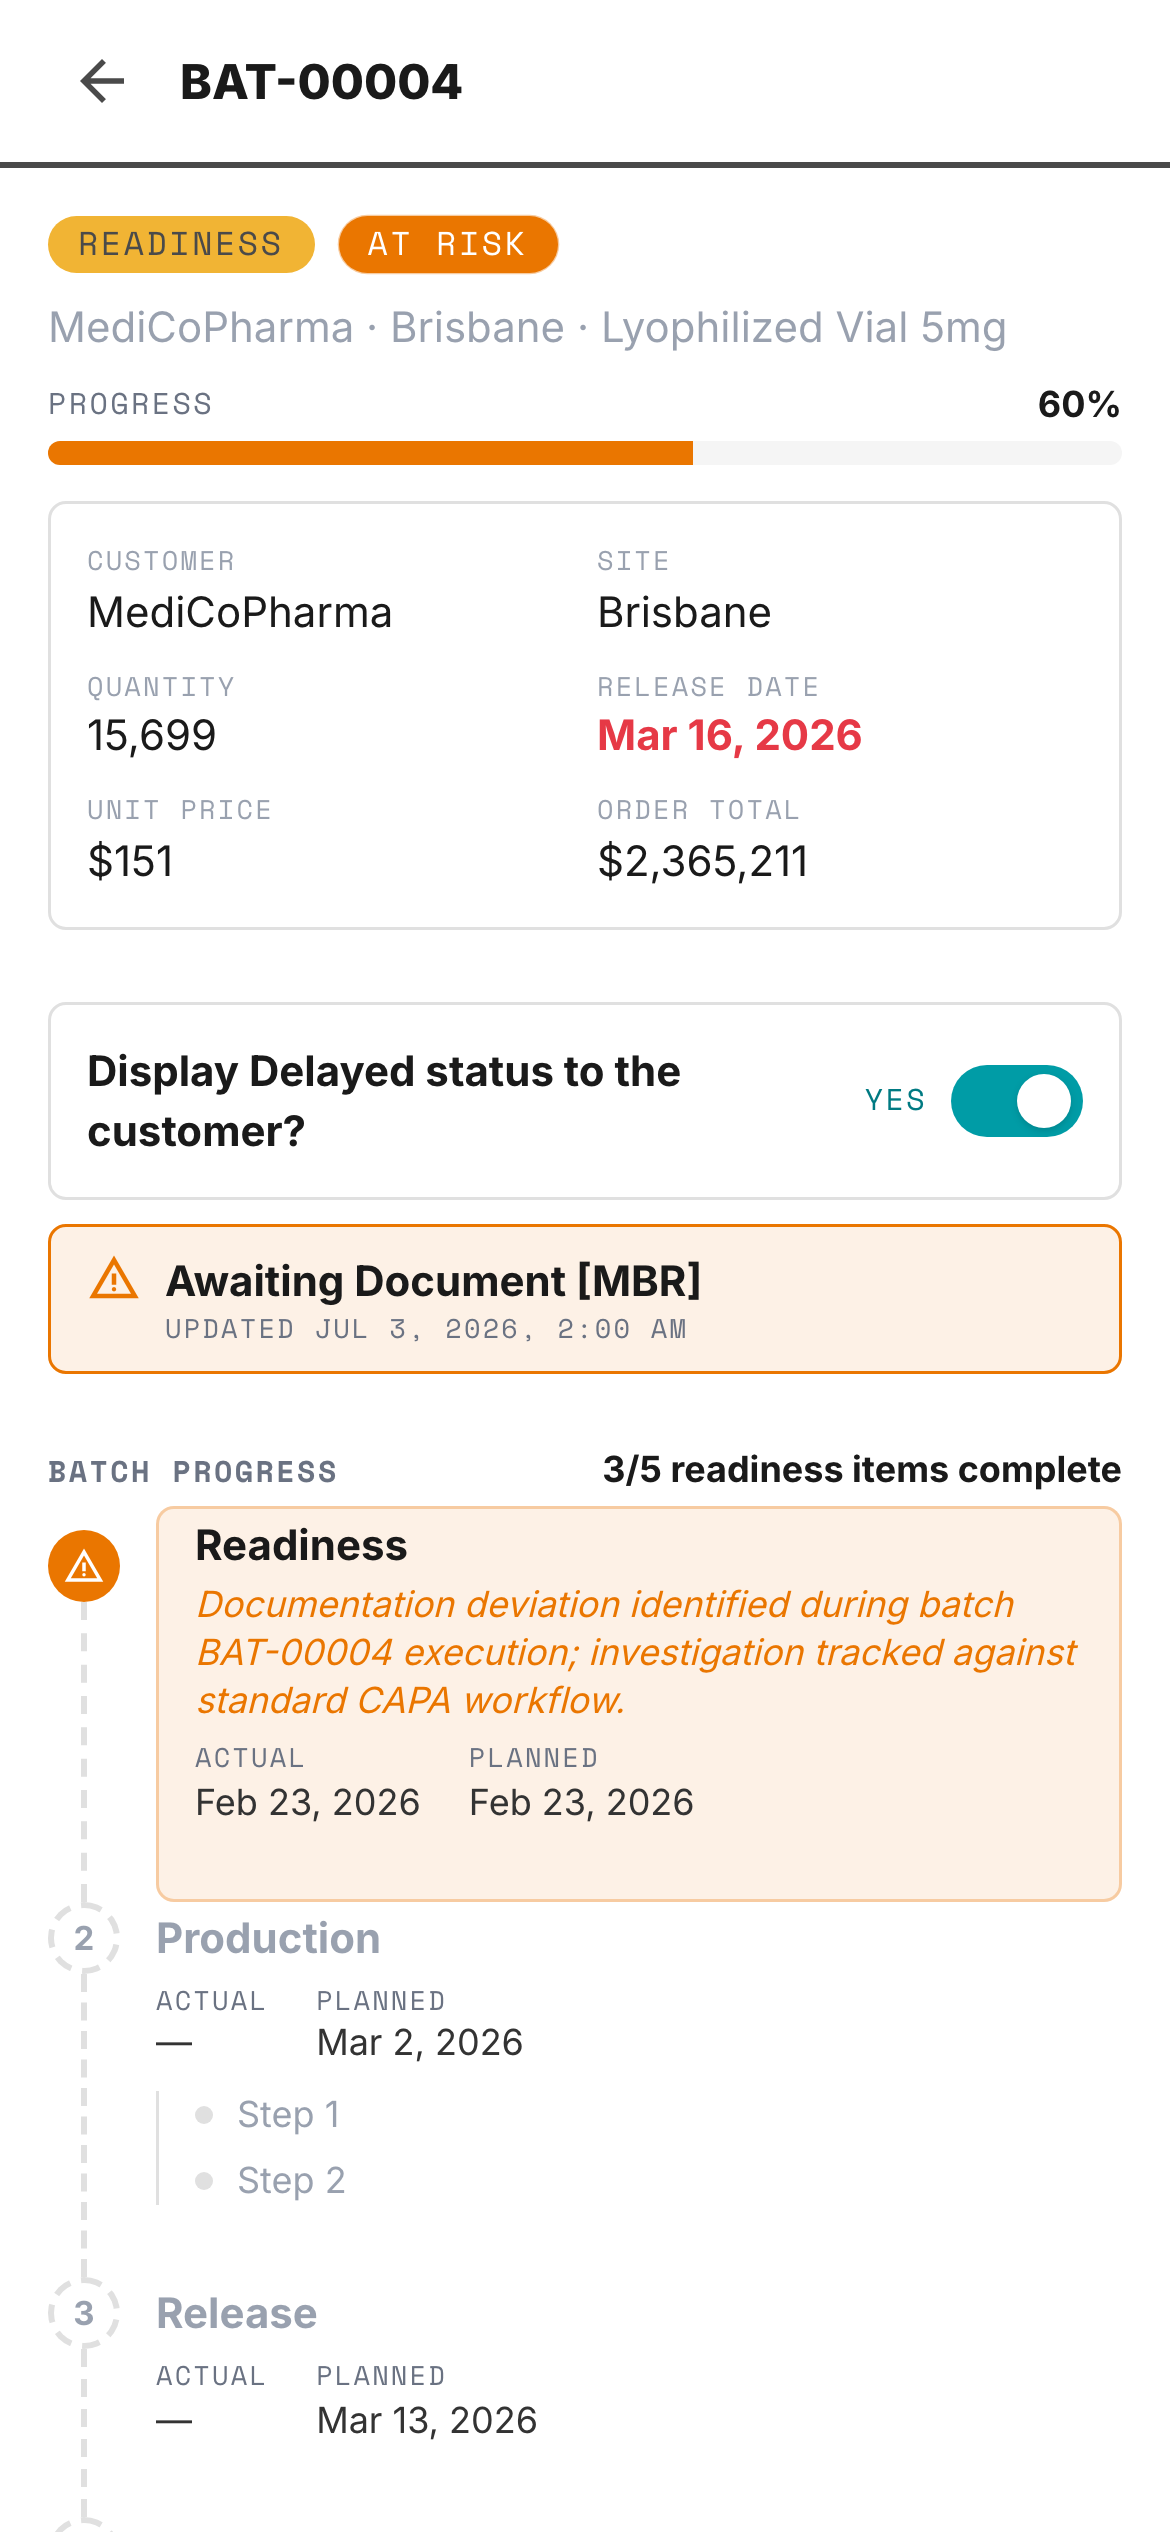
Nobody chases status. It flags itself.
Two KPIs. One shared truth.
Flag a constraint. Jump straight to it.
One workflow. Every screen.
64px / −.04em
32px / −.03em
16px / −.01em
14px / body
11px / labels
9px / timestamps
| Partner | On Time | Right First Time | On-Time In Full | Deviation Closure | Trend | Status |
|---|---|---|---|---|---|---|
| GSK | 97% | 95% | 85% | 12d | On Track | |
| Amgen | 97% | 95% | 85% | 12d | On Track | |
| MediCoPharma | 82% | 89% | 78% | 22d | At Risk | |
| PMJ Group | 89% | 91% | 82% | 16d | Watch | |
| BioHorizoCo | 74% | 81% | 70% | 28d | Critical | |
| Zenith Pharma | 93% | 94% | 88% | 10d | Strong |
| Site | Q1 | Q2 | Q3 | Q4 |
|---|---|---|---|---|
| St. Louis | 91 | 88 | 94 | 97 |
| Brisbane | 84 | 88 | 82 | 90 |
| Princeton | 78 | 82 | 85 | 89 |
| Groningen | 92 | 95 | 93 | 96 |
| Line | Feb | Mar | Apr | May | Jun | Jul |
|---|---|---|---|---|---|---|
| Ferentino | ||||||
| ST 1 Liq & Lyo | 75% | 75% | 98% | 85% | 98% | 85% |
| ST 2 Liq & Lyo | 61% | 98% | — | — | — | 107% |
| Monza | ||||||
| Fill Line 1 | 70% | 85% | 92% | 95% | 88% | 102% |
| Fill Line 2 | 55% | 72% | 68% | 80% | 85% | 78% |
| Greenville | ||||||
| Bulk MFG Line A | 65% | 78% | 82% | 88% | 92% | 85% |
| Fill & Finish 1 | 80% | 88% | 92% | 98% | 102% | 95% |
Four failure modes.
Four systems.
Zero spreadsheets.
mySupply moved exception detection upstream — from the delivery gate, where resolution cost 3–5× more, to a week earlier. Thirty-two interviews across nine sites mapped directly onto the four systems above: exceptions that surface themselves, batches that flag their own risk, one shared number instead of two disputed ones, and a forecast-to-capacity loop that used to take a phone call and a spreadsheet. The world’s largest pharma CDMO. Zero to live in twelve months.
197 orders.
Three that matter.
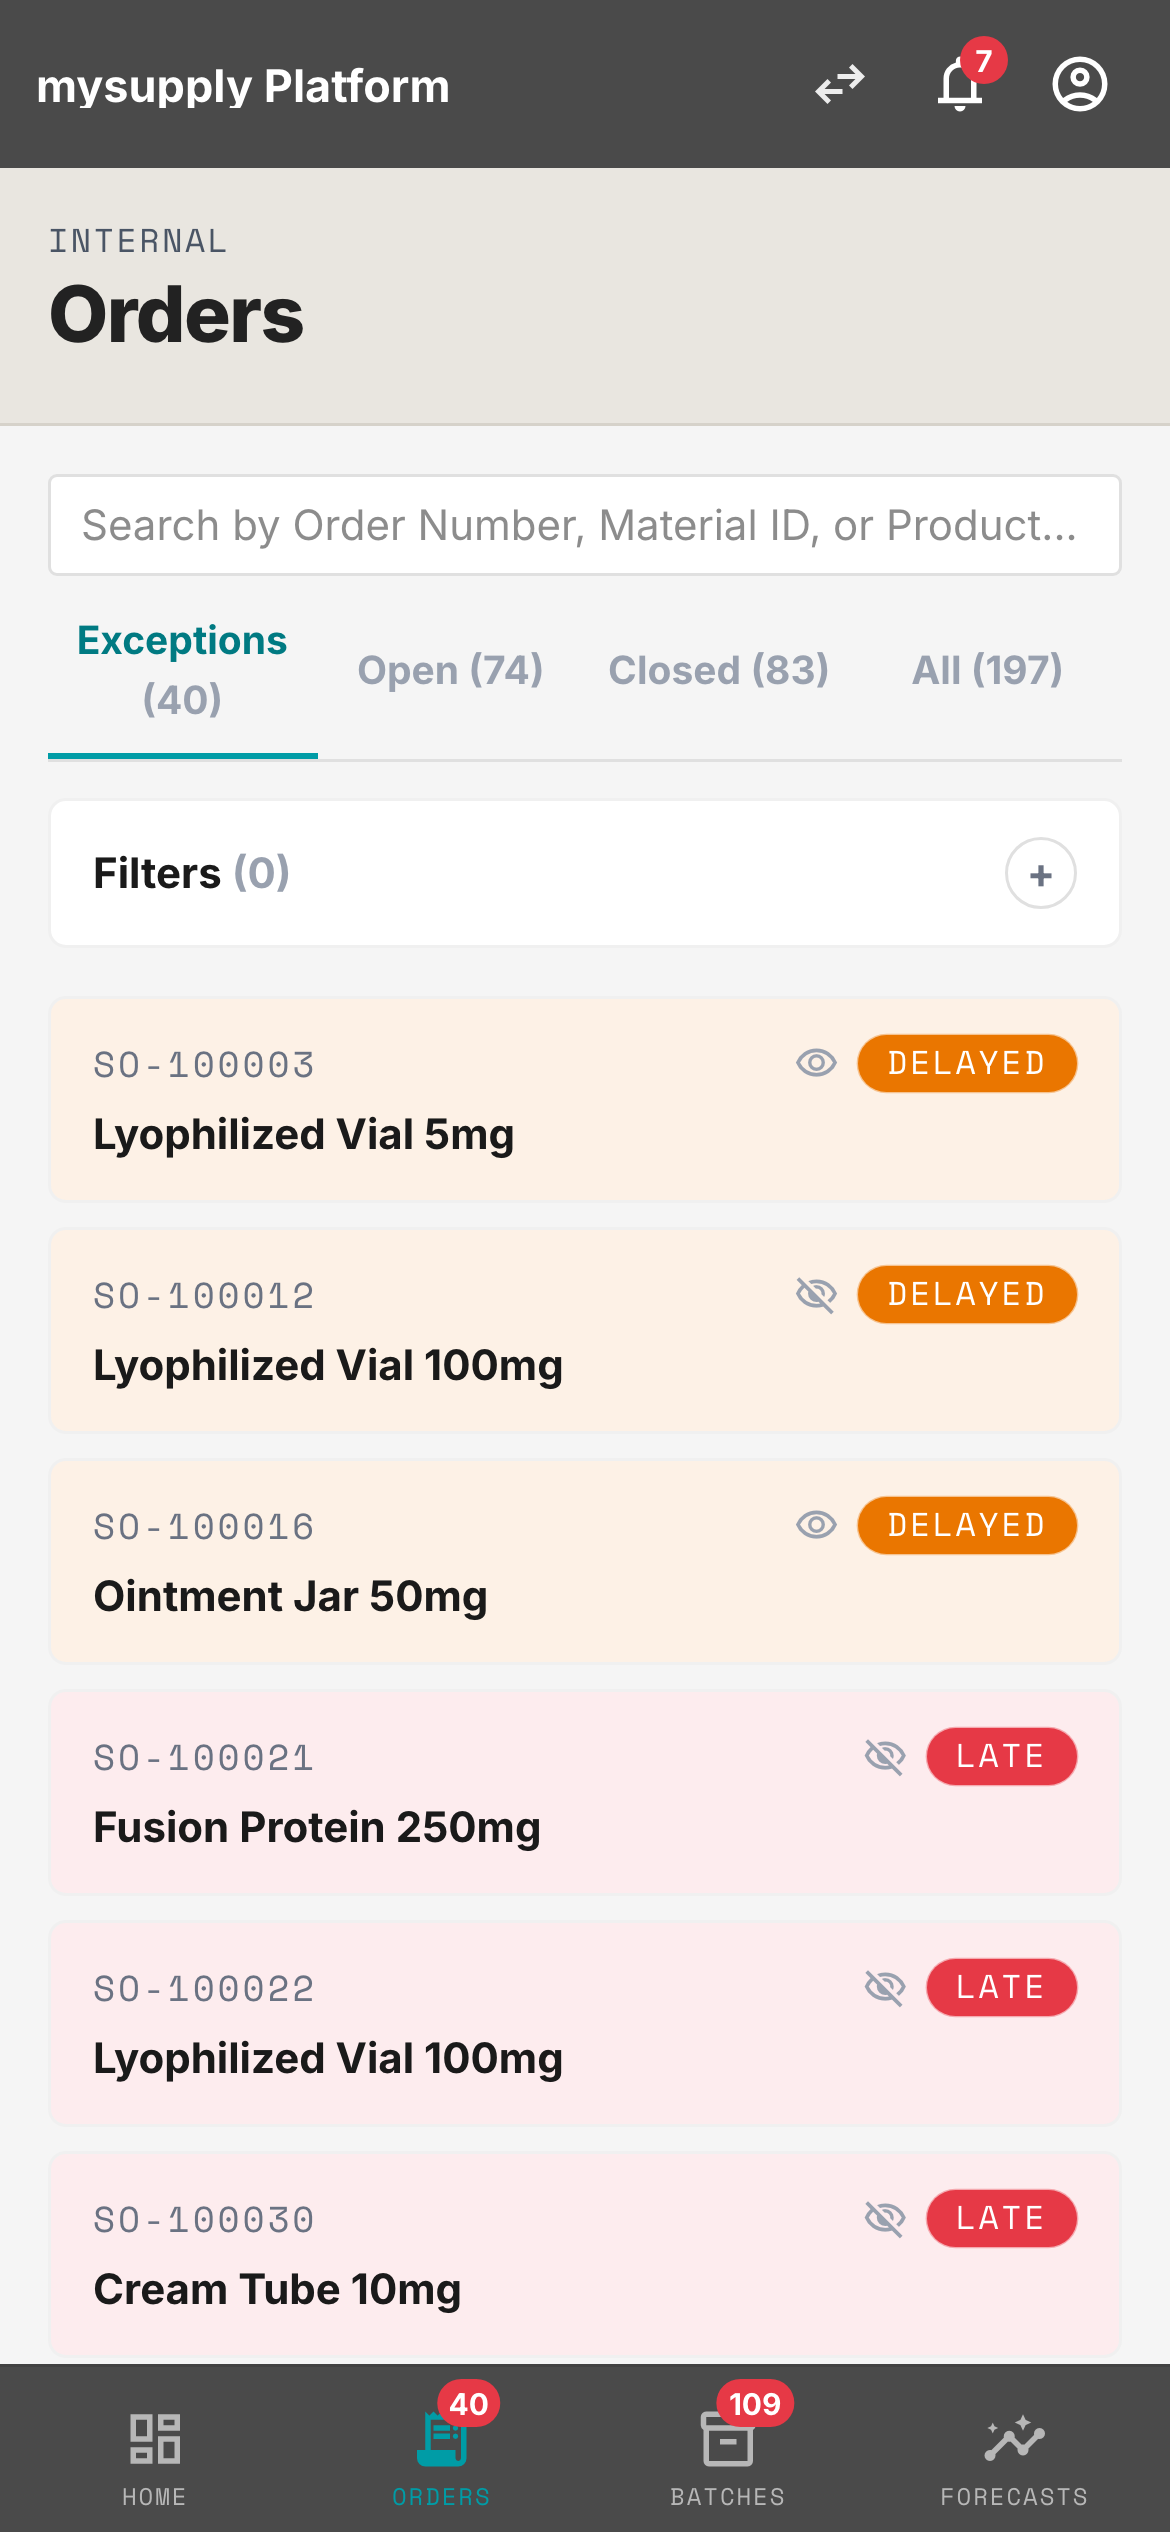
The redesign made exceptions the default. At-risk and late orders surfaced automatically — managers opened to what needed action, not a flat list of 197. The “All” tab was still there. Nobody needed it.
Internal numbers.
Customer numbers. Both.
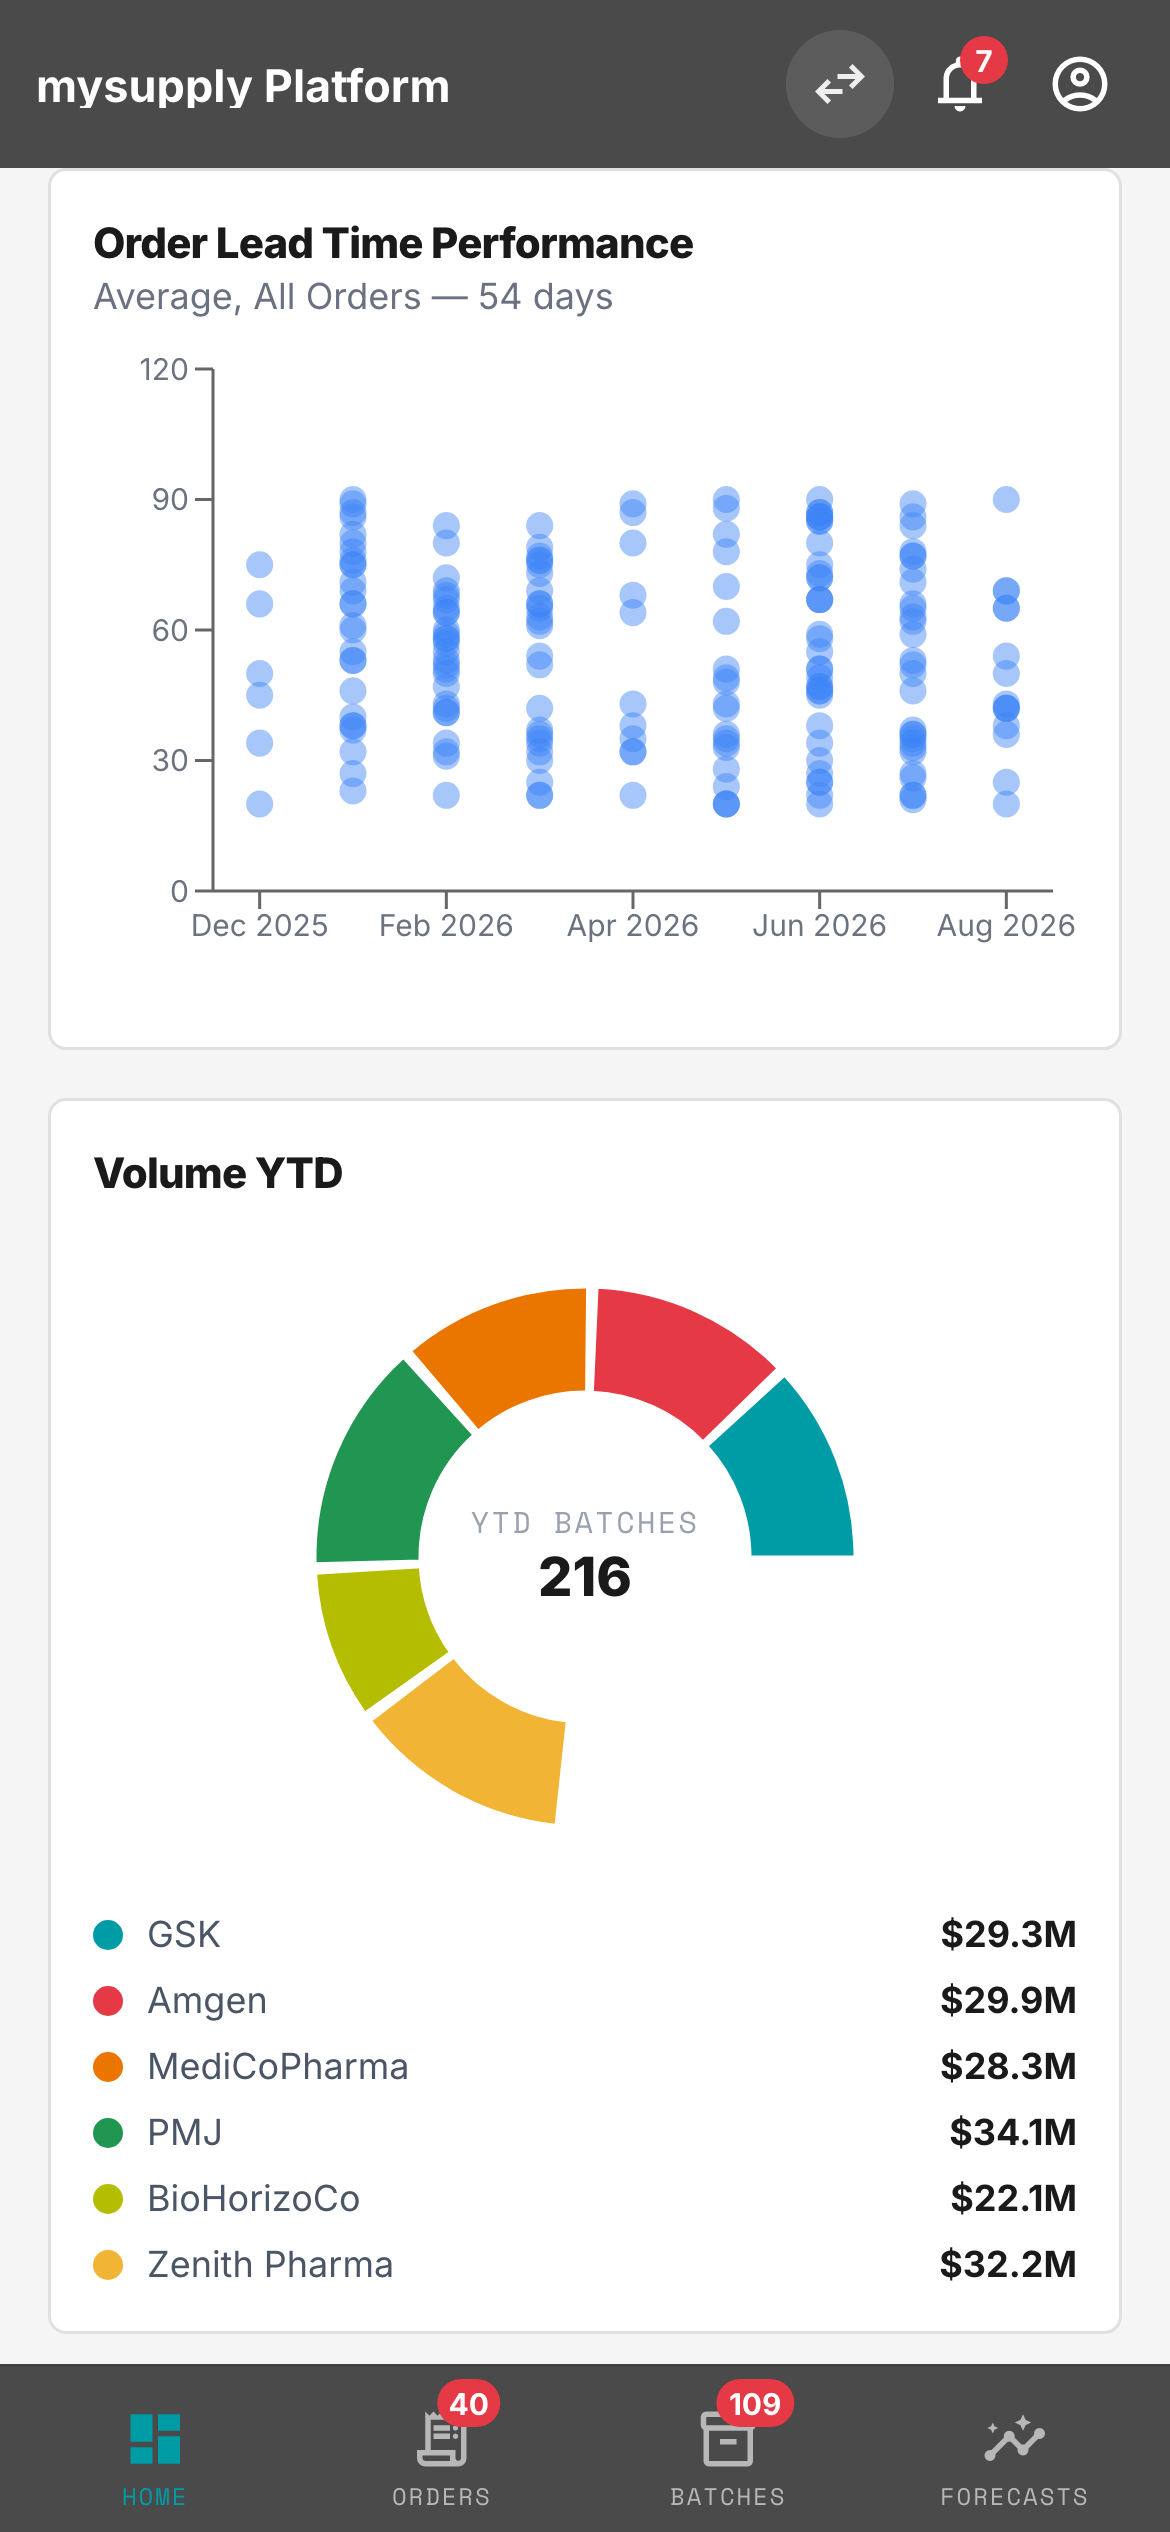
The Dashboard put both OTD KPIs side by side — Thermo Fisher’s and each partner’s, per site, per partner — in a single view. Both sides saw the same gap for the first time. No basis to dispute it. Only to close it.
Flag a constraint.
Fix it without losing your place.
Forecasts used to arrive as emailed spreadsheets; capacity was discovered only after a partner had already committed to volume. Now a flagged month opens straight into that site’s utilization heatmap, then back to the forecast to revise and comment — one connected workflow where there used to be two disconnected ones.