02
Thermo Fisher Scientific · mySupply Digital Supply Chain · 2021

The supply chain six partners never had.

No platform existed. Six pharma partners running nine manufacturing sites on spreadsheets and phone calls — sharing nothing, seeing nothing, learning about exceptions at the delivery gate when the cost was already three to five times higher than catching them a week earlier. One platform ended that. All six companies adopted it. Zero to live in twelve months.
Request the full case study
01ClientThermo Fisher Scientific
02ProjectmySupply digital supply chain
03RoleProduct Design Director
04Team1 designer · 2 engineers (BCG DV)
05Scale12 months · 6 partners · 9 sites · EU + NA + AU
06Outcome$20M margin opportunity · 100% partner adoption · 83% IRR
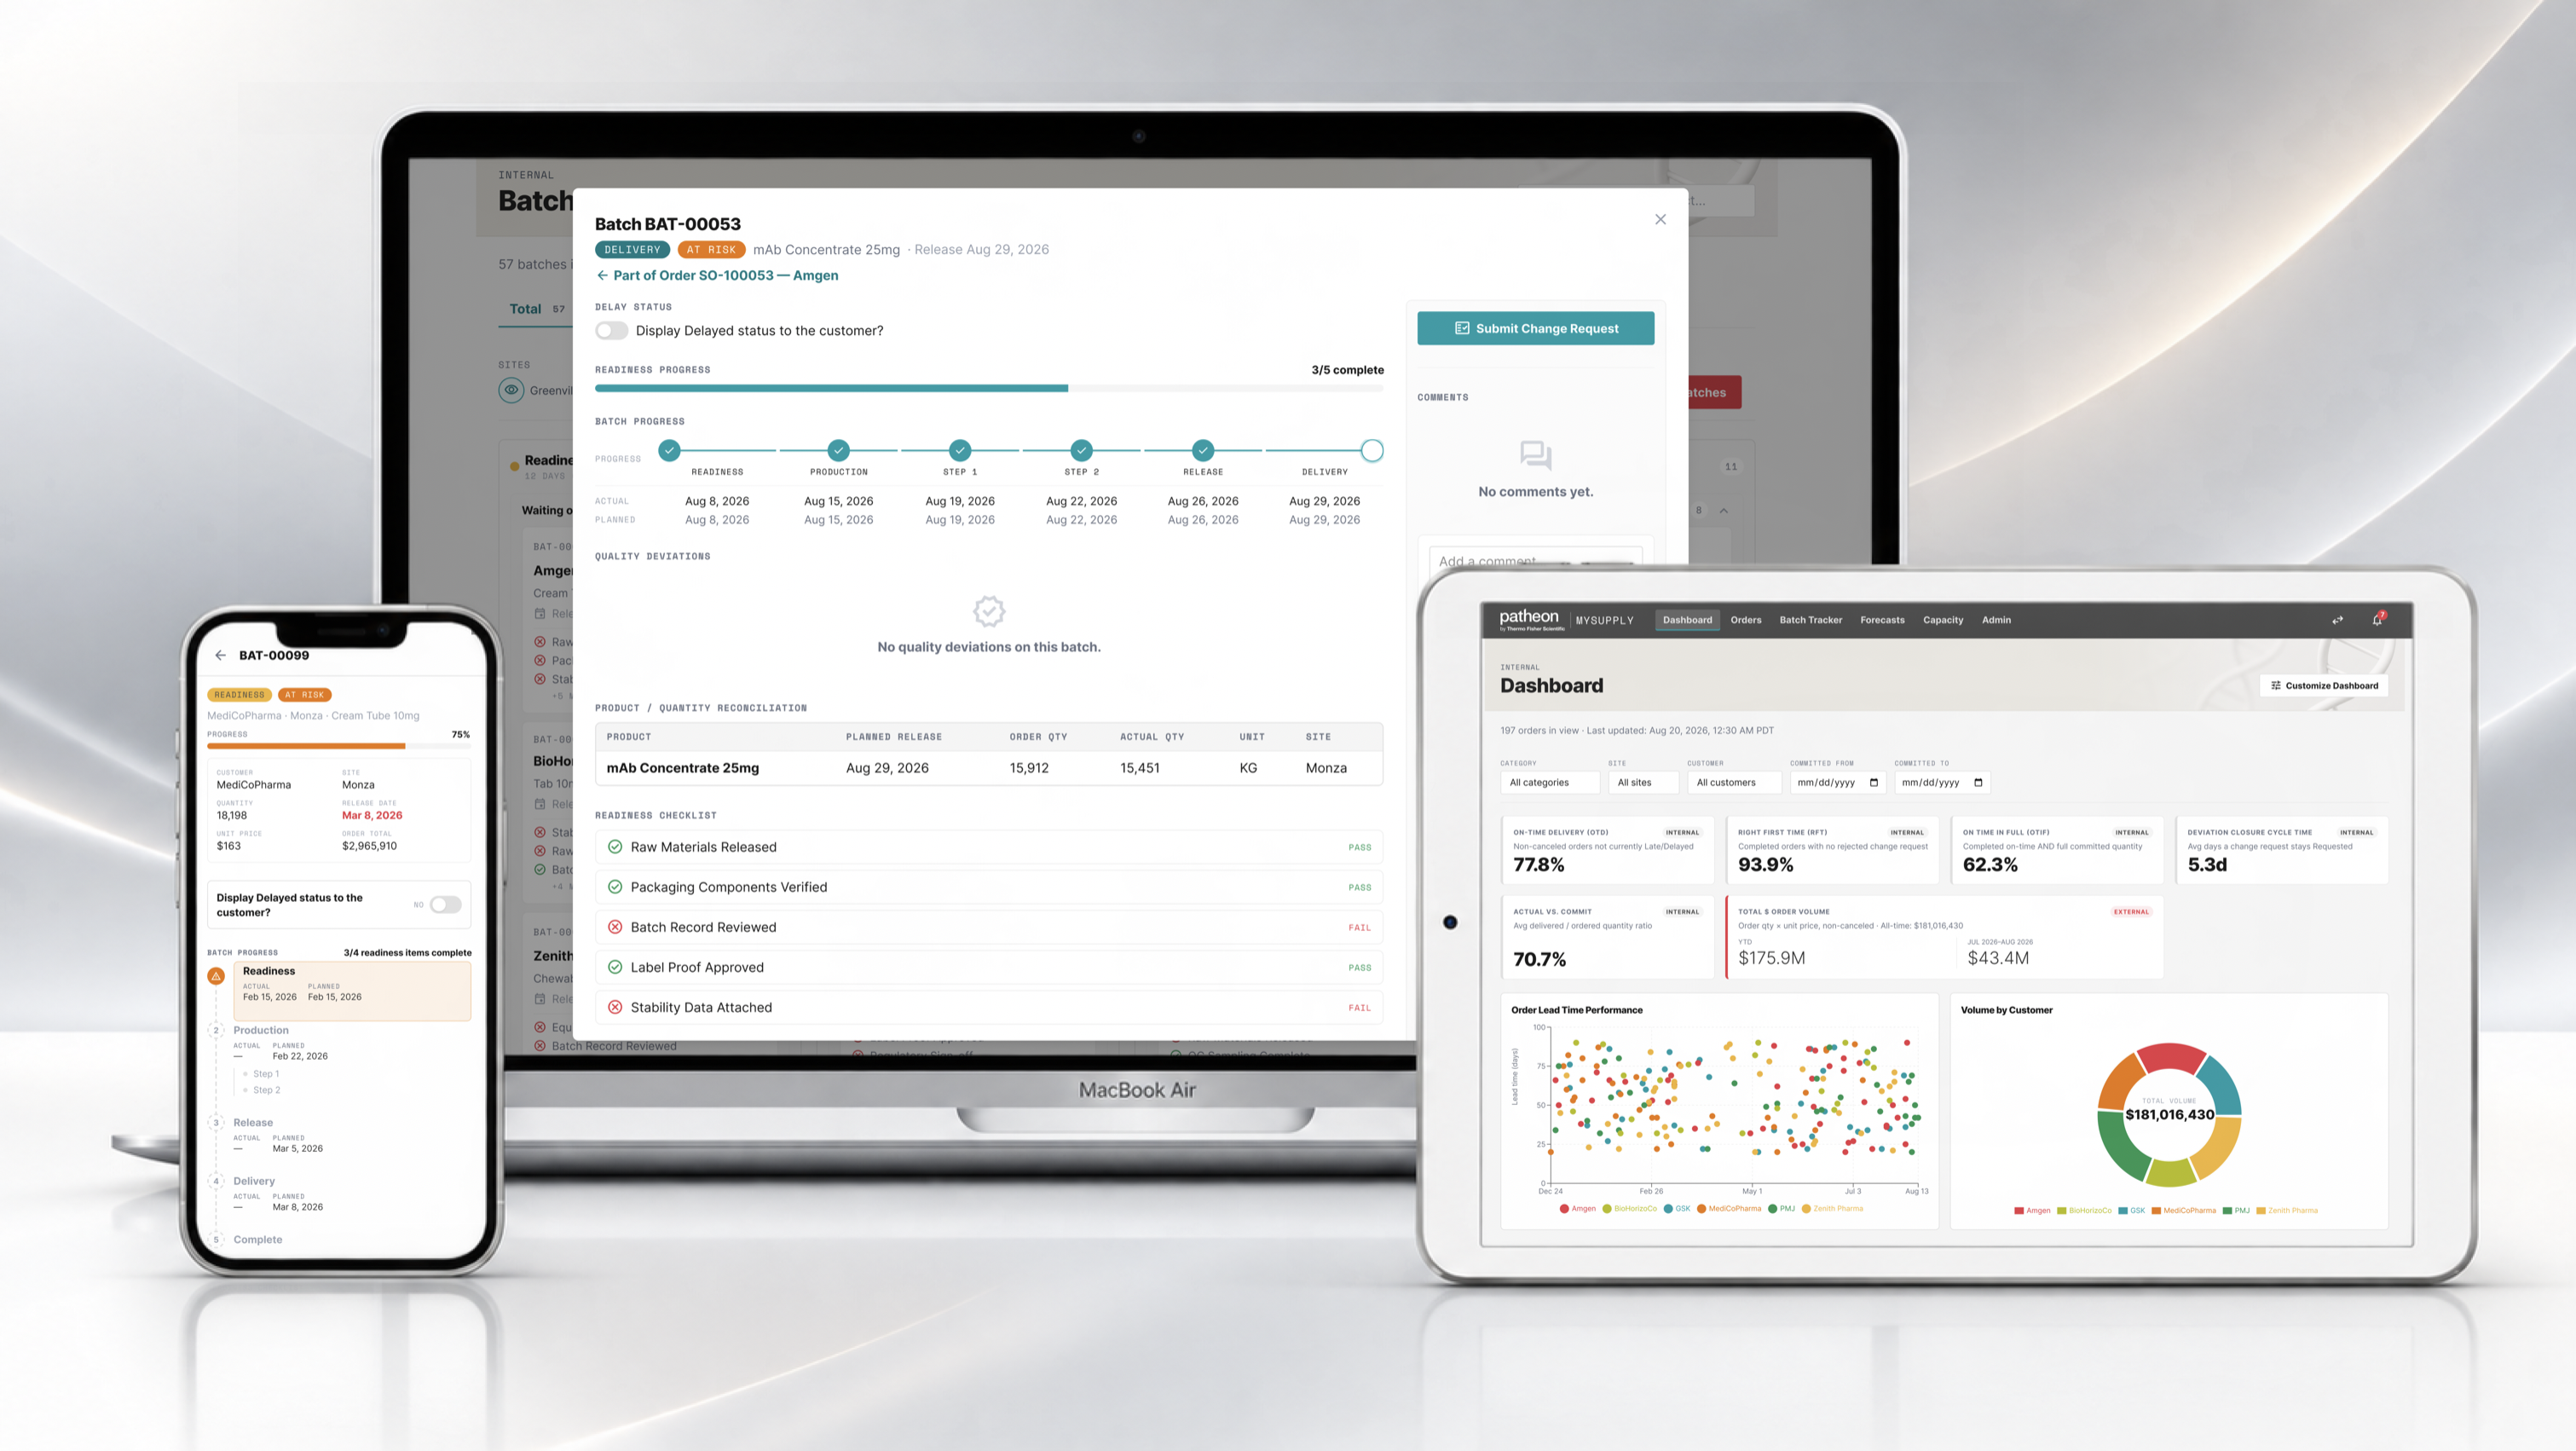
Live Platform · mySupply Dashboard
mysupply.patheon.com/supply-chain/batches
⌘K
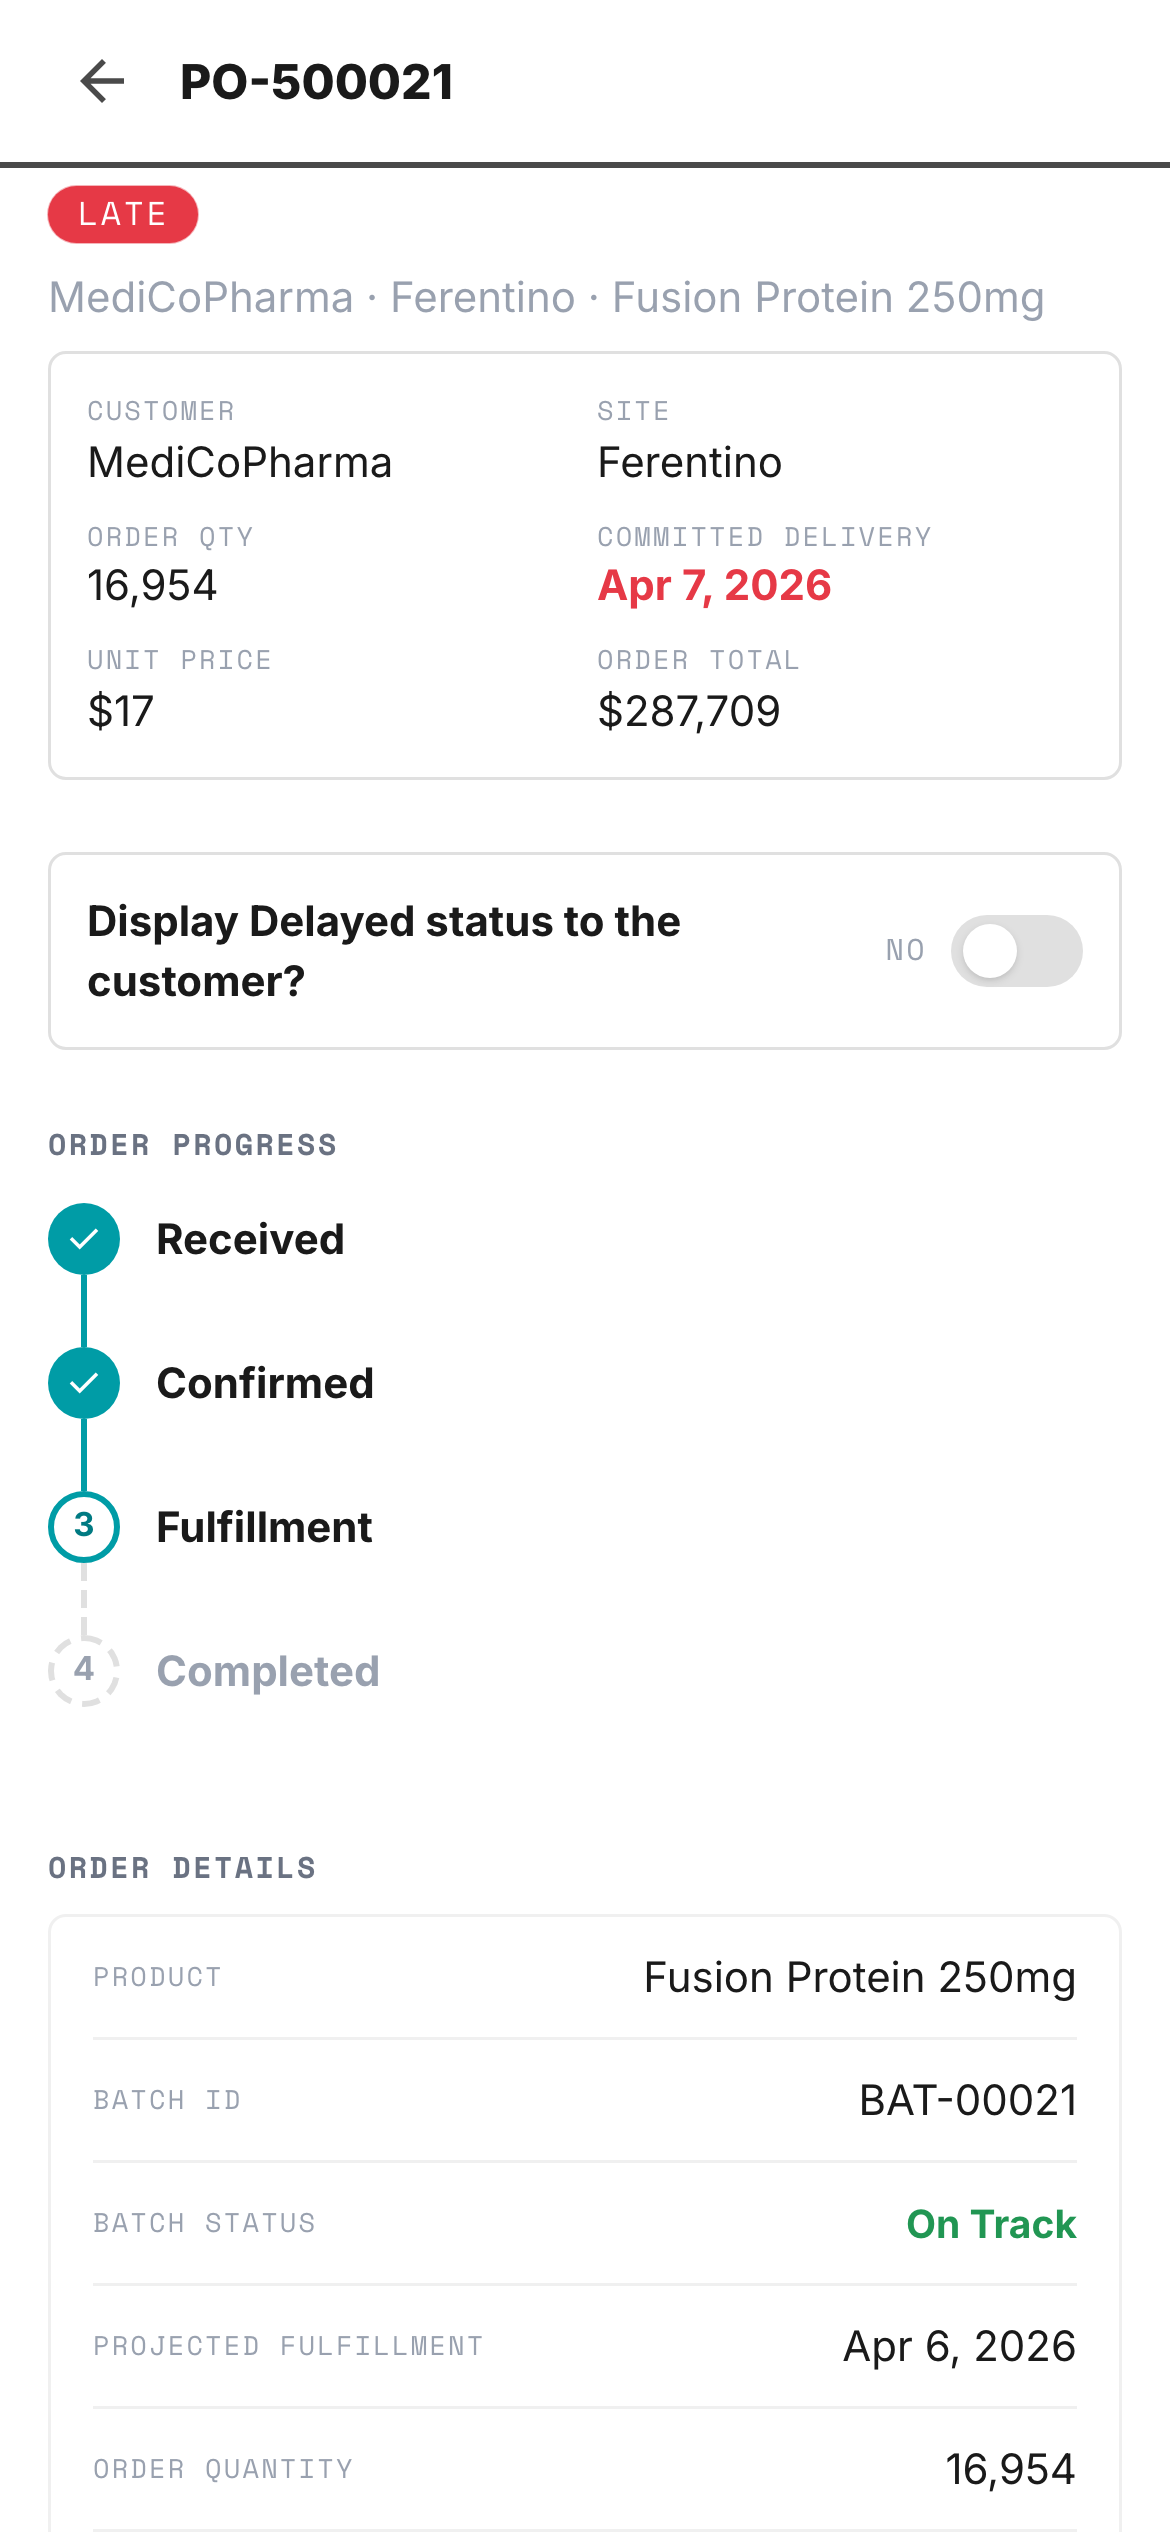
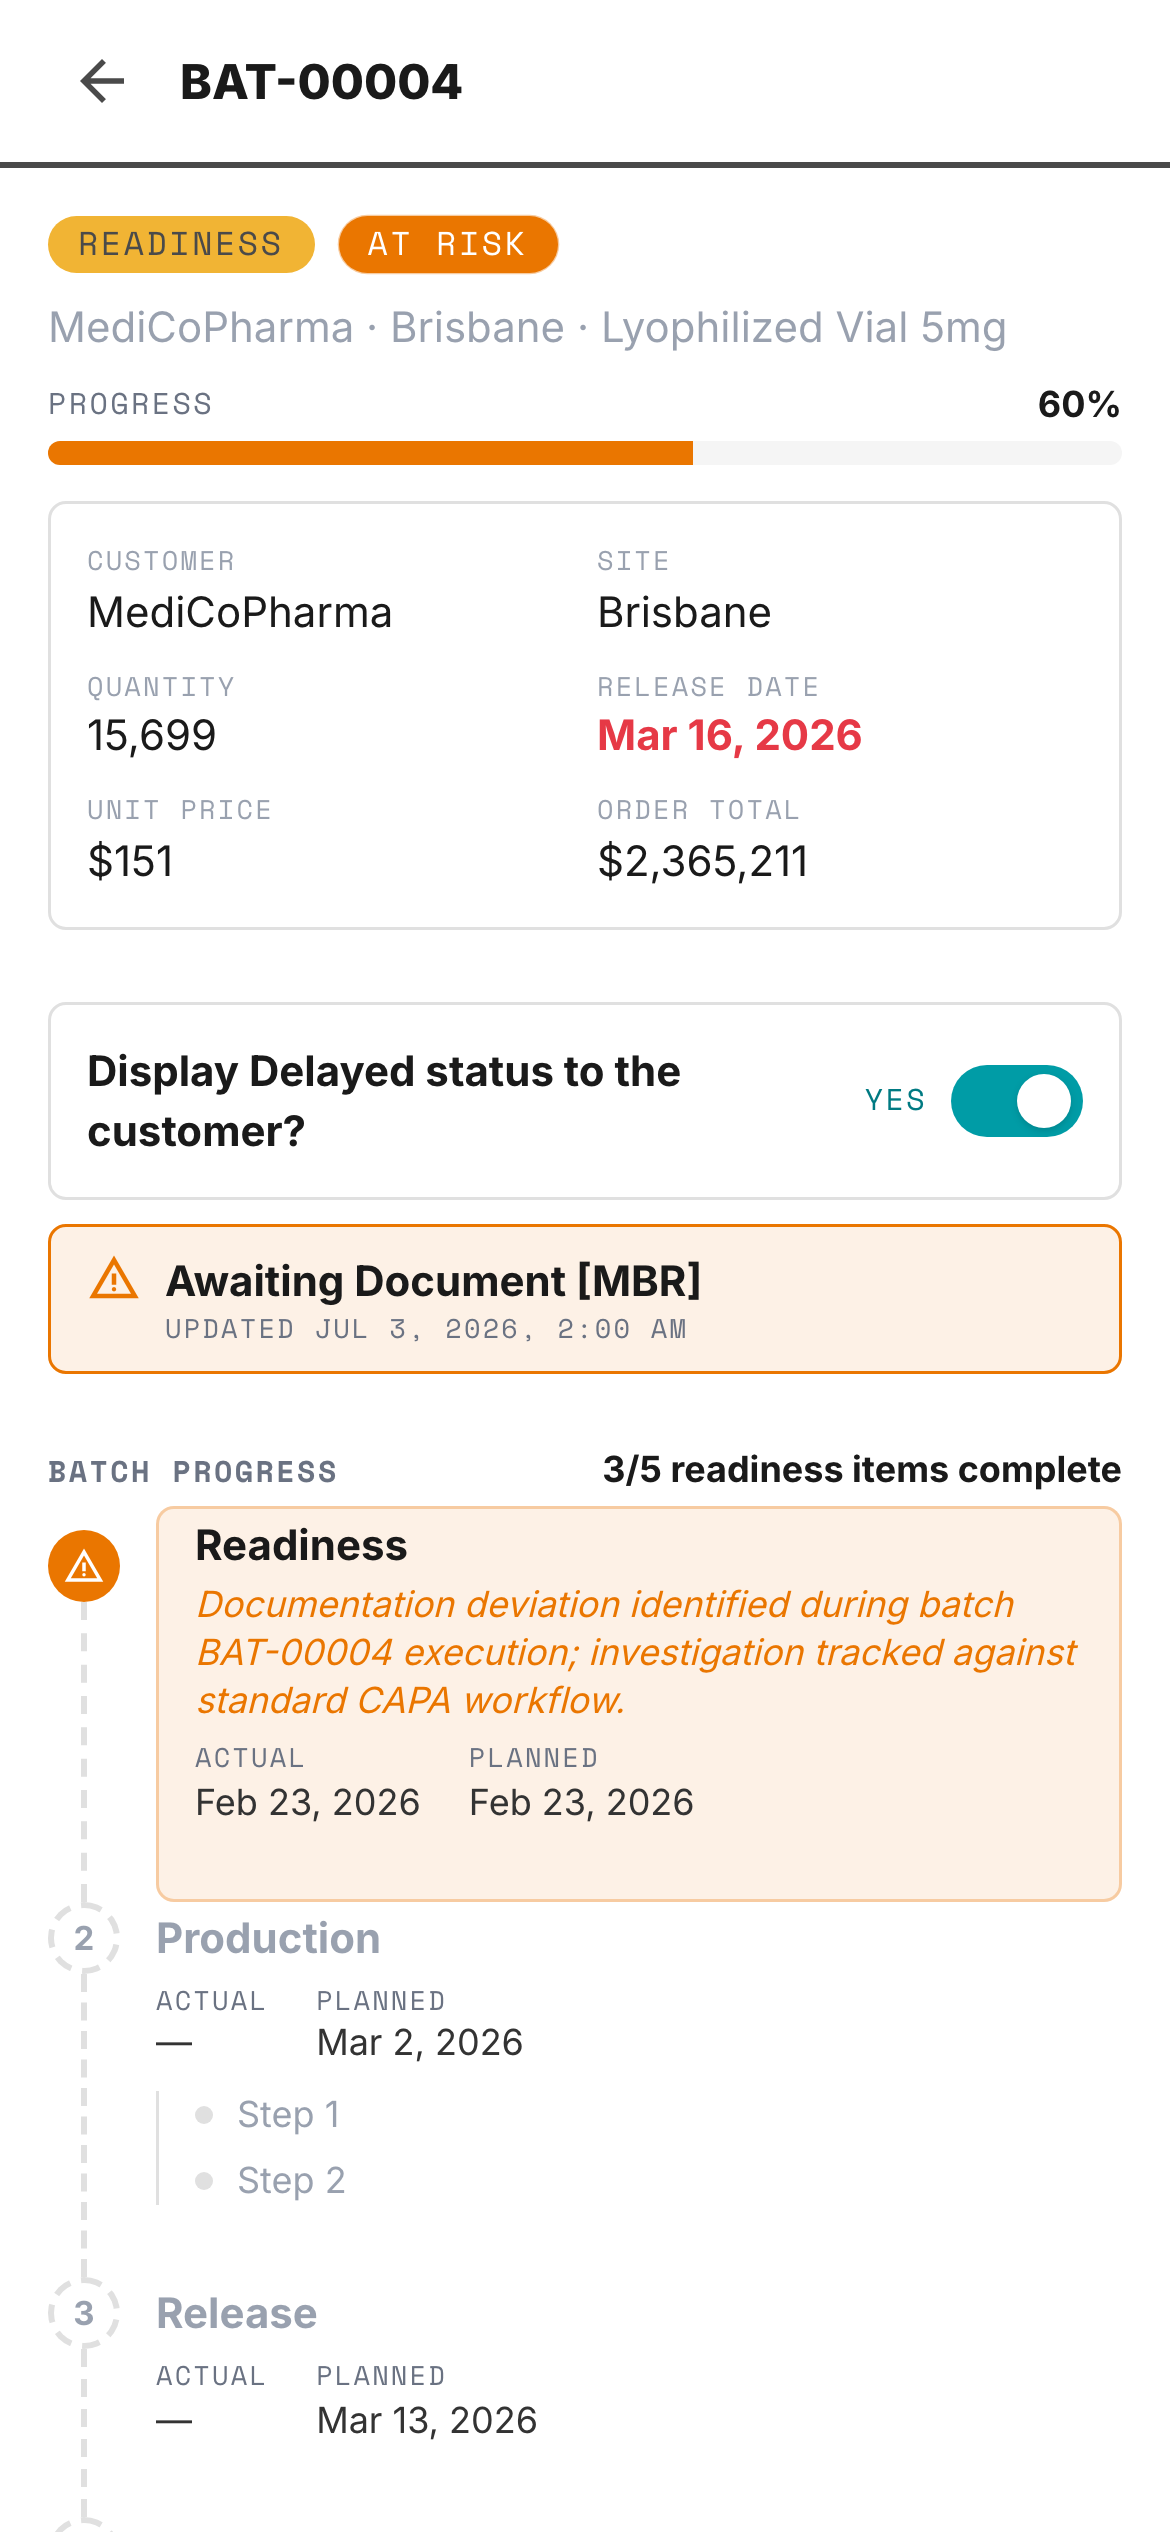
mysupply mobile · Batch Detail
Batch Detail ···
AB1234 Manufacturing At Risk
GSM · Ferentino · Cetraxal 10mg/mL 2mL Vial
Progress 65%
Customer
GSM
Site
Ferentino
Quantity
12,000 units
Release Date
28-FEB-2020
Unit Price
$14.50
Order Total
$174,000
Batch Timeline
Materials Received
10-JAN-2020
Manufacturing Started
15-JAN-2020
In-Process Testing
Est. 05-FEB-2020
Sterility and particulates tests pending
Quality Control Review
Est. 20-FEB-2020
Qualified Person Release
Est. 26-FEB-2020
Stage Checklist
Raw materials reconciled
Line clearance confirmed
Sterility test
Pending
Particulates check
Home
4
Orders
Batches
Forecasts
2
More
01 · Color Tokens
Teal Primary
#009ca6
Brand · CTAs · On-Track
Teal Dark
#007a82
Hover · Active
Exception Red
#e71316
LATE · Critical
At-Risk Orange
#ea7600
Warning · AT RISK
Success Green
#6dc66d
Released · Positive Δ
Agent Purple
#7b68ee
AI · 5th data series
Nav Dark
#4a4a4a
Navigation bar
Surface
#f5f5f5
Page BG · Light mode
02 · Status Badges
Exception States
LATE AT RISK ON TRACK HOLD RESOLVED
Workflow States
APPROVED REVIEW DRAFT
LATE/AT RISK pulse every 2.6s → halts on acknowledge
03 · Buttons
04 · Type Scale · Inter + Space Mono
Inter 800
64px / −.04em
Aa
Inter 700
32px / −.03em
Batch Monitor
Inter 600
16px / −.01em
Section heading
Inter 400
14px / body
Body text for descriptions and supporting content throughout the platform.
Mono 700
11px / labels
ON TRACK · ORD-2891
Mono 400
9px / timestamps
2024-01-08T09:14:22Z
05 · KPI Card Component
On-Time Delivery
97%
All Partners · YTD
↑ +2pp vs last quarter
Exceptions
7 open
Monza Util.
102%
AI Gate Reviews
24 this wk
87% avg confidence
Analytics · Partner Performance
Partner Scorecard
The first time all six pharma partners saw each other’s delivery performance in one place. OTD, Right First Time, and OTIF benchmarked weekly — not at month-end when corrections were already impossible. Q4 2021.
PartnerOn TimeRight First TimeOn-Time In FullDeviation ClosureTrendStatus
GSK97%95%85%12dOn Track
Amgen97%95%85%12dOn Track
MediCoPharma82%89%78%22dAt Risk
PMJ Group89%91%82%16dWatch
BioHorizoCo74%81%70%28dCritical
Zenith Pharma93%94%88%10dStrong
3
Partners above SLA
↑ +1 QoQ
2
Elevated risk
↓ 1 this month
1
Critical — BioHorizoCo
3 weeks declining
Analytics · Site Performance
Program Health
Eight active programs across all partners. When a site’s quality score trends down two quarters running, the conversation starts before a batch is at risk — not after.
On Track
5
Elev. Risk
2
High Risk
1
High risk: Cetraxal Phase III · 3 wks below yield
Site Quality Score · Q1–Q4 2021 · Rolling four quarters
SiteQ1Q2Q3Q4
St. Louis91889497
Brisbane84888290
Princeton78828589
Groningen92959396
On-Time Delivery
97%
All Partners · YTD avg
↑ +2pp vs last quarter
Active Batches
148
3 sites · 6 products
18 at-risk batches
Open Exceptions
7
+12 AT RISK
LATE · flagged today
↓ 3 resolved this week
On-Time In Full
85%
vs 88% target · Q4
↓ 3pp gap to close
Data Viz · Delivery Trend
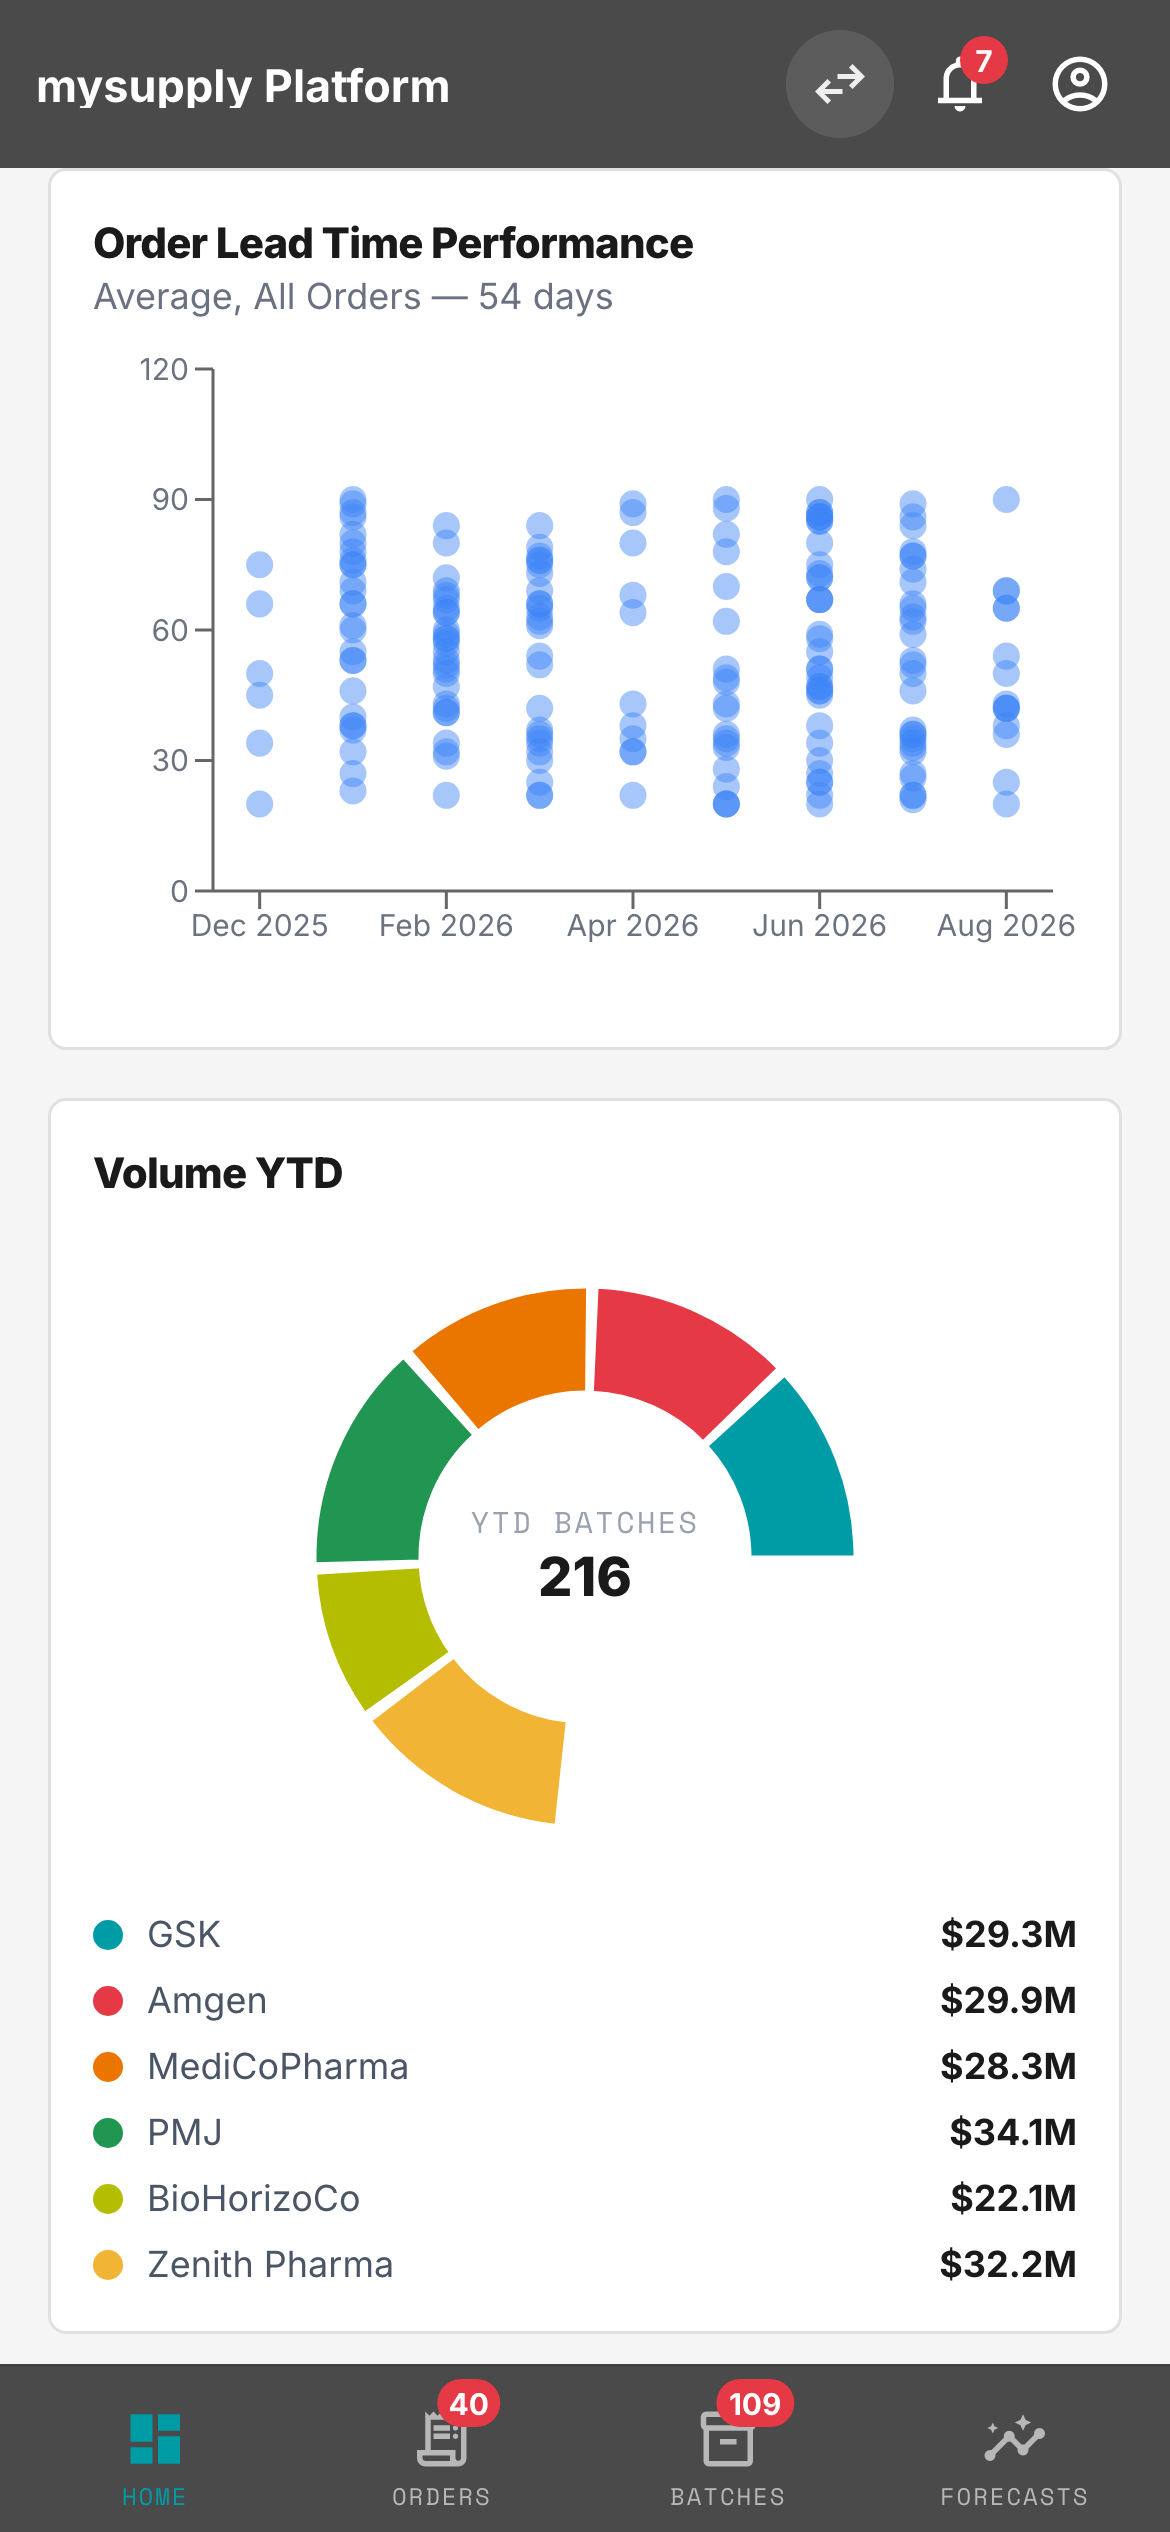
12-Week On-Time Delivery
The baseline that changed how partners approached the weekly call. A shared view of what was actually true — not what each side thought was true. Reference line at 97% target.
100%97%95%92% Target W1W3W5W7W9W11 98% peak
Data Viz · Exception Summary
Order Status Breakdown
LATE and AT RISK are the two states that cost money. Donut split makes the ratio scannable in under a second. The number you care about is always the red slice.
64 ORDERS
45 On Track
70.3%
12 At Risk
18.8%
7 Late
10.9%
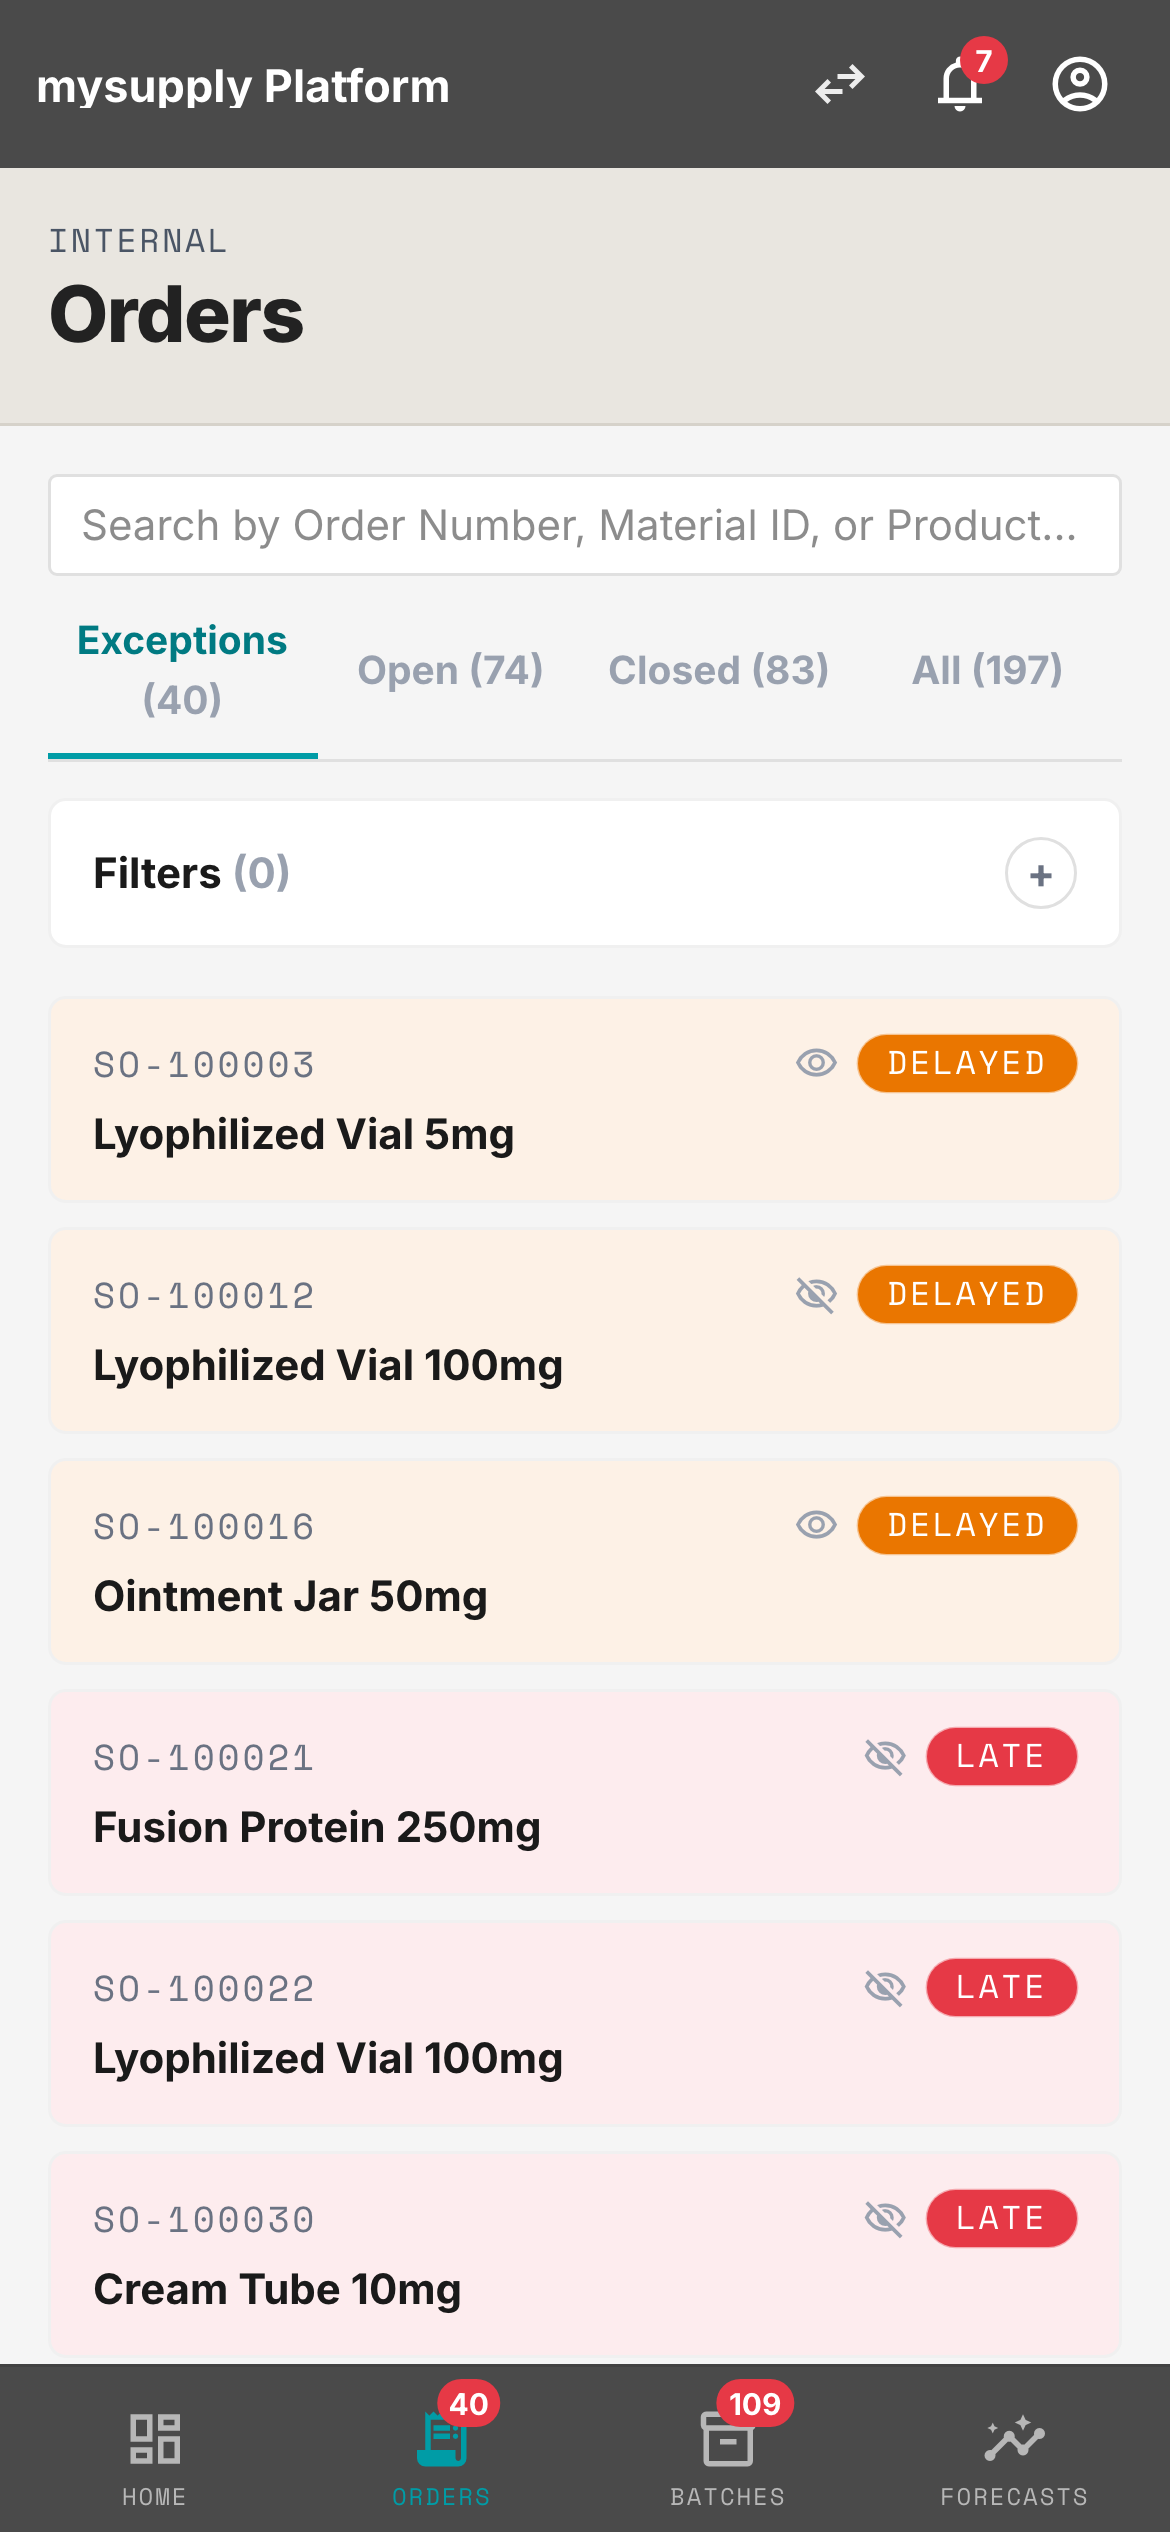
Orders 25 orders · 7 exceptions flagged
Order # Customer Product Site Ship Date Status Batch
ORD-2847MediCoPharmaCetraxal 10mg/mLFerentino28-FEB-2020LATEAB1234
ORD-2891BioHorizoCoOncovex-B 250mgMonza14-MAR-2020AT RISKBC0441
ORD-2914PMJ GroupPaclitaxel 6mg/mLGreenville05-MAR-2020LATEBC0337
ORD-2956GSKMeropenem 1g/vialGreenville22-APR-2020On TrackBC0518
Order Exceptions 7 late · 12 at risk
Live
7
LATE
12
AT RISK
45
ON TRACK
ORD-2847
MediCoPharma · Cetraxal
LATE
ORD-2891
BioHorizoCo · Oncovex-B
AT RISK
ORD-2914
PMJ Group · Paclitaxel
LATE
ORD-2956
Zenith Pharma · CytaRx
AT RISK
View all 19 exceptions →
Data Viz · Forecast vs Actual
Volume Commit — Oncovex-B
Partners commit volume months in advance. When actuals diverge, both sides need to see it immediately — not in the next quarterly review. 97.4% forecast accuracy was the platform outcome, not the input.
1.5k1.0k0.5k JanFebMarAprMayJun
Forecast
Actual
Actual exceeded
Jun Variance
+3.2%
Actual exceeded forecast
Avg Accuracy
97.4%
Jan–Jun 2021
Total Committed
7.9M
Units · H1 2021
Data Viz · Site Capacity
Manufacturing Utilization Heatmap
Six lines across three sites. Red means overcommitted — a conversation that used to happen at month-end now happens the day the cell turns orange. Ferentino ST2 at 107%: that’s the conversation that recovered $2M.
Line Feb Mar Apr May Jun Jul
Ferentino
ST 1 Liq & Lyo75%75%98%85%98%85%
ST 2 Liq & Lyo61%98%107%
Monza
Fill Line 170%85%92%95%88%102%
Fill Line 255%72%68%80%85%78%
Greenville
Bulk MFG Line A65%78%82%88%92%85%
Fill & Finish 180%88%92%98%102%95%
Scale: 55–65% 70–83% 85–98% 100%+ — planned
Data Viz · Batch Pipeline
Stage Distribution by Site
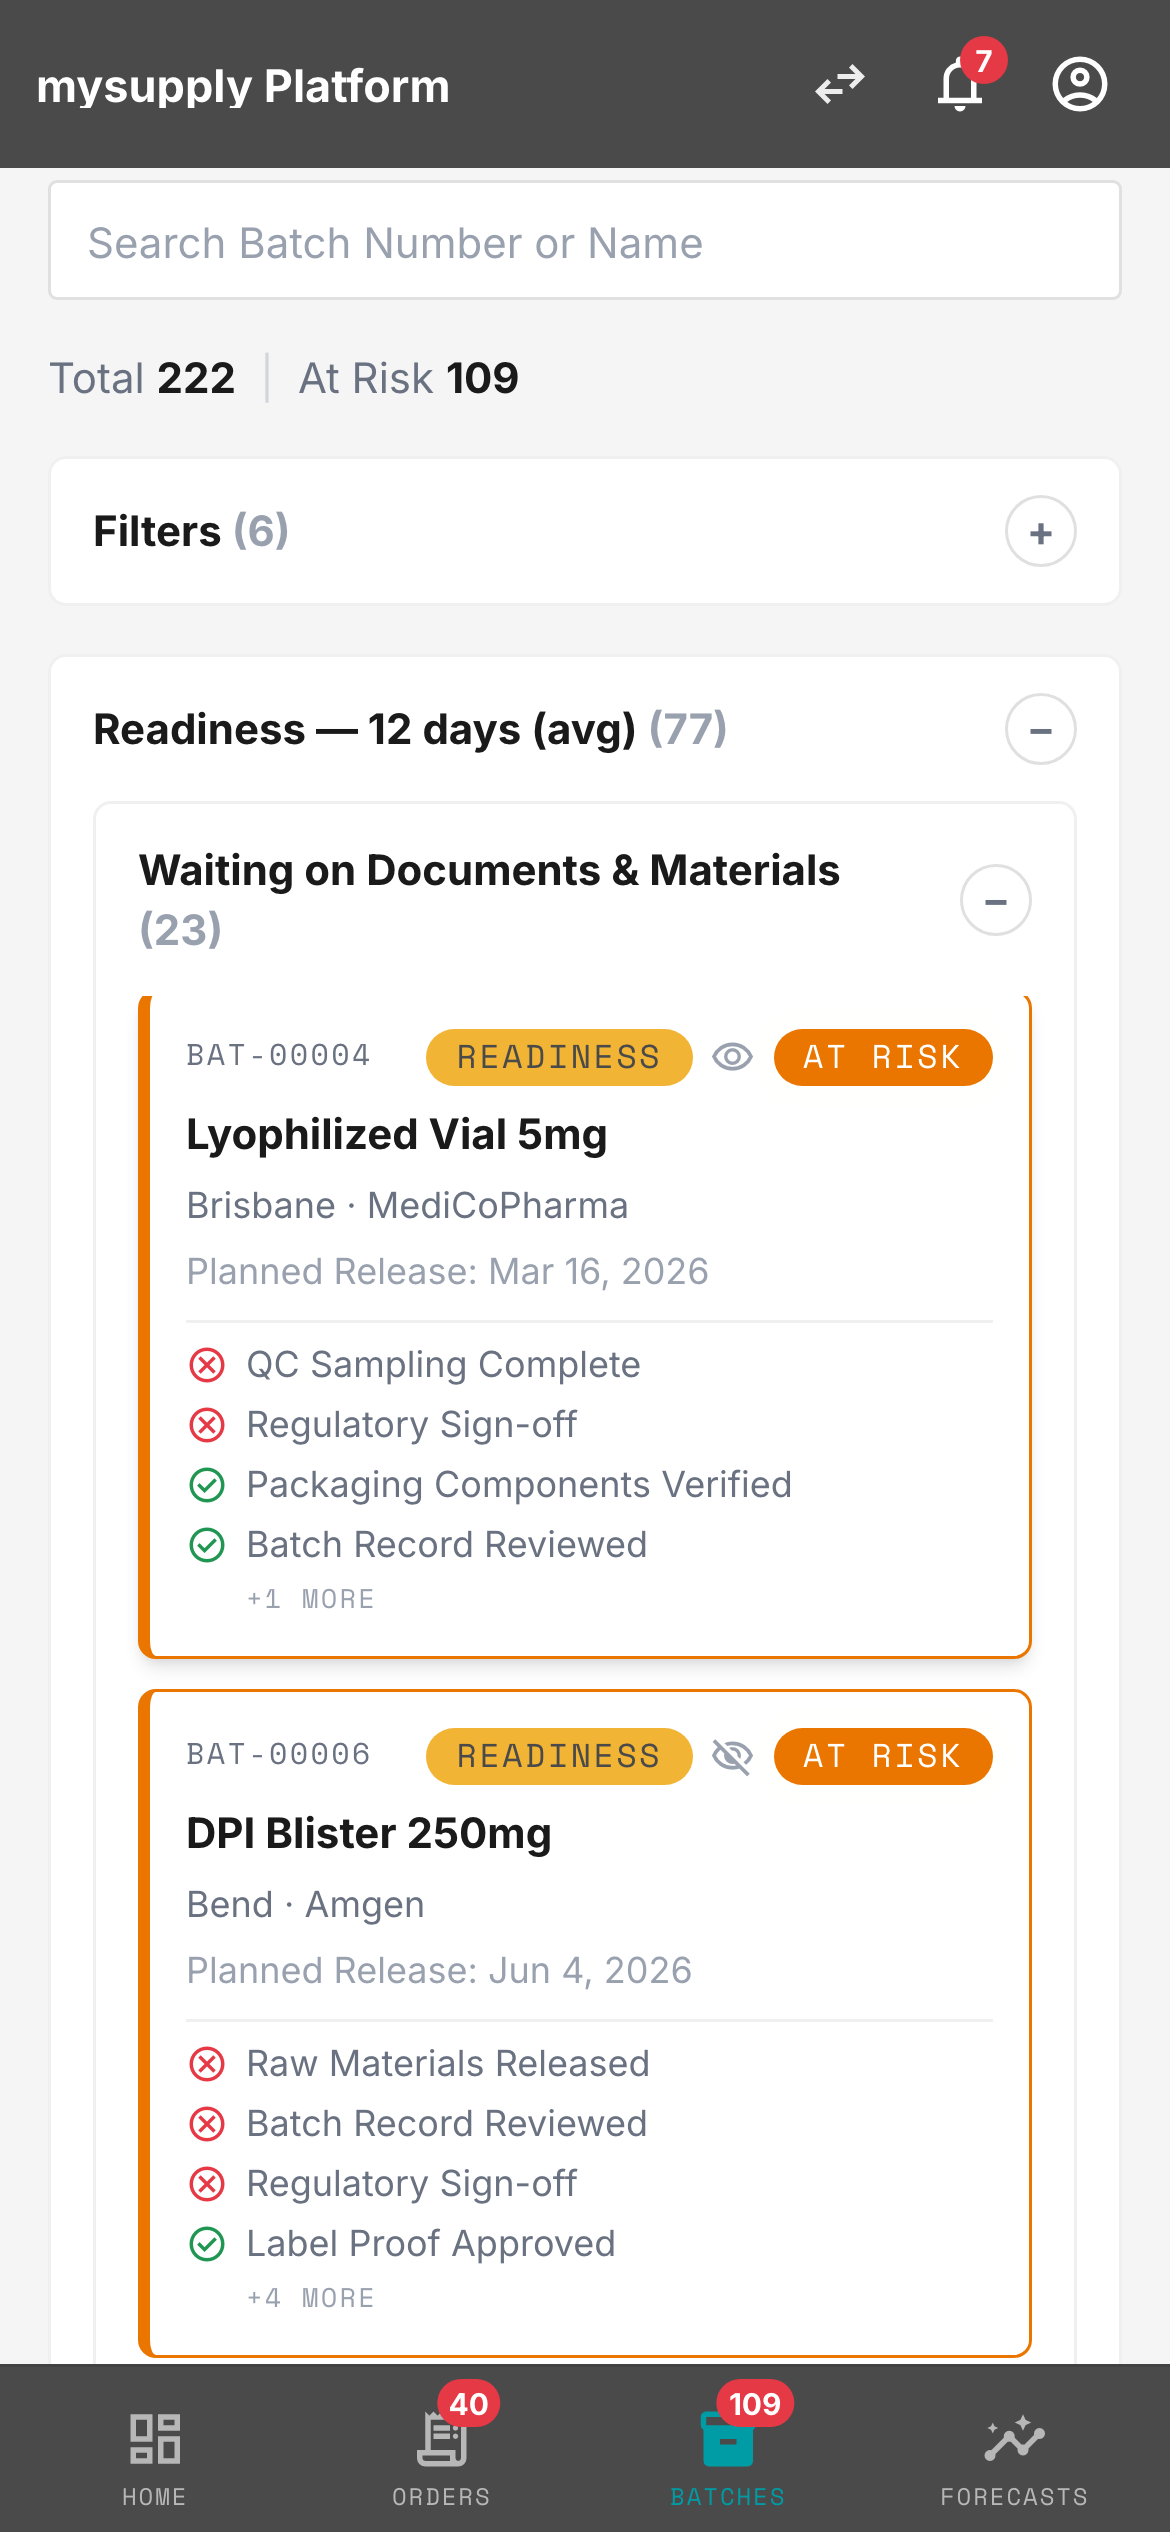
148 active batches across three sites. Where they are in the pipeline tells you where the risk is accumulating before any single batch goes late.
Monza
Greenville
Ferentino
Formulation
8
4
6
18
Testing
12
6
9
27
Packaging
10
5
7
22
Quarantine
6
4
13
Released
30
18
20
68
AB1234 AT RISK Ferentino · IT
Batch Info
Release Date28-FEB-2020
SiteFerentino, Italy
ProductCetraxal 10mg/mL
CustomerMediCoPharma
Batch Timeline
Materials Received
10-JAN-2020
Manufacturing Started
15-JAN-2020
In-Process Testing
Est. 05-FEB-2020
Sterility test pending
Quality Control Review
Est. 20-FEB-2020
Qualified Person Release
Est. 28-FEB-2020 — Overdue
View full batch record →
13 · Regulatory Constraints · GDP & cGMP
Design within the framework, not around it.
Every design decision in mySupply sits downstream of two regulatory regimes. They defined what matters. The platform makes it visible.
Good Distribution Practice

Every batch movement across nine sites requires documented chain of custody. A visibility gap isn’t a UX inconvenience — it’s a compliance failure. The platform replaced phone calls and spreadsheets with a single auditable record.

Current Good Manufacturing Practice

Sterility tests, yield checks, deviation closure — each step documented before the batch moves forward. The platform surfaces what QA needs to see. It doesn’t replace the review. It gets the evidence there in time.

The Design Consequence

Every red cell in the heatmap, every LATE badge in the exceptions panel — downstream of a regulatory framework that already defined what matters. Design job: make the constraint visible before it becomes a violation.

Case Study 02 —— Thermo Fisher Scientific · mySupply Digital Supply Chain

Five failure modes.
Five modules.
Zero spreadsheets.

mySupply moved exception detection upstream — from the delivery gate, where resolution cost 3–5× more, to a week earlier. Thirty-two interviews across nine sites, five failure modes turned into five modules. The world’s largest pharma CDMO, zero to live in twelve months.

The cost of equal weight.

197 orders.
Three that matter.

The redesign made exceptions the default. At-risk and late orders surfaced automatically — managers opened to what needed action, not a flat list of 197. The “All” tab was still there. Nobody needed it.

Both sides. Same gap.

Internal numbers.
Customer numbers. Both.

The Dashboard put both OTD KPIs side by side — Thermo Fisher’s and each partner’s, per site, per partner — in a single view. Both sides saw the same gap for the first time. No basis to dispute it. Only to close it.

Thirty-two interviews. Five failure modes.

Warehouse floor.
Planning room.

Five failure modes, five module briefs. Forecasts emailed as xlsx files became structured submissions with SAP auto-load. Capacity constraints discovered post-commitment became an 18-month utilization heatmap — visible before the next commitment. The research was the architecture.